
Shift share can be found in the Industry Table, Occupation Table, and Program Table in Analyst and Developer.
Shift share is an economic indicator that tells you which industries (or occupations) are competitive in your region. How?
Shift share shows you the national growth (in terms of jobs) of a particular industry. Based on this national growth, it then calculates how much the industry is likely to grow in your region, and compares this estimation with how much the industry actually grew.
If the industry grew roughly the same in your region as it did nationally, it might not be particularly competitive, because it stands to reason that it’s growing in your region simply because it is growing everywhere. But if it grew more than it did across the nation, this means the industry is probably growing due to your region’s particular strengths, and indicates that it is a competitive industry for your region.
In this article, we’ll define the four components of shift-share analysis, and then show you how to apply it.
The Four Components of Shift Share
Shift-share analysis includes four components: (1) industrial mix effect, (2) national growth effect, (3) expected change, and (4) regional competitive effect. We’ll walk through each of these below.
Note: For the following definitions and example, we will use shift share analysis at the industry level, but note that it can also be done at the occupation level. (See endnotes for more on this.)
1. Industrial Mix Effect – The industrial mix effect is the number of jobs we would expect to see added (or lost) within an industry in your region, based on the industry’s national growth/decline. If the industry is growing or declining at the national level, it can dependably grow or decline in smaller regions.
Industrial mix effect is calculated by applying the job growth of the industry at the national level to the same industry at the regional level. We start by subtracting the national growth rate of the overall economy from the national growth rate of the specific industry. This gives us a national industry premium which is an indication of how much that industry outperformed or underperformed the economy as a whole nationwide.
Industry Growth Rate – National Economy Growth Rate = Industry Premium
This rate (a percentage) is then applied to the number of the industry’s regional jobs:
Industry Premium x Number of Regional Industry Jobs = Industrial Mix Effect
2. National Growth Effect – The national growth effect shows the number of jobs an industry is expected to gain or lose according to the industry’s national job growth. So if the industry sees national net job growth, you can expect to see job growth in most regions within the country as well.
This is sometimes explained as “the rising tide that lifts all boats.” Imagine several boats floating near the shore. If the tide begins to rise, each boat will rise with the tide–just as each boat will lower when the water lowers. This rising and falling is the national growth effect. It’s important to remember, however, that sometimes one of these “boats” (which are industries, in this case) may be pulled down deeper in the water, or may be experiencing higher tides on its own. These phenomena can be explained by competitive effect (see below).
To measure the national growth effect, we simply multiply the growth rate of the overall economy to the number of jobs in your region that are part of the industry.
National Growth Rate x Number of Regional Industry Jobs= National Growth Effect
3. Expected Change – Expected change is the amount of job growth or decline that we would expect to see for a particular regional industry based on the national growth effect and the industry (or occupation) mix effect. Job change beyond this level is “unexpected” and can therefore be attributed to the region’s unique competitive effect (see definition below).
To measure expected change, we simply add the two effects we previously calculated:
Industrial Mix Effect + National Growth Effect = Expected Change
4. Competitive Effect – The regional competitive effect indicates how much of the job change within a given region is the result of some unique competitive advantage of the region. As explained above, this is because the competitive effect, by definition, measures the job change that occurs within a regional industry that cannot be explained by broader trends (i.e. the National Growth Effect and the Industrial Mix Effect).
To measure competitive effect, we subtract Expected Change from the actual regional job change in the industry of interest.
Actual Change – Expected Change = Competitive Effect
It’s important to note that this effect can be positive even if regional employment is declining. This would indicate that regional employment is declining less than national employment.
Examples
The graph below shows the four shift-share components for each of these four industries in the Chicago metro area.
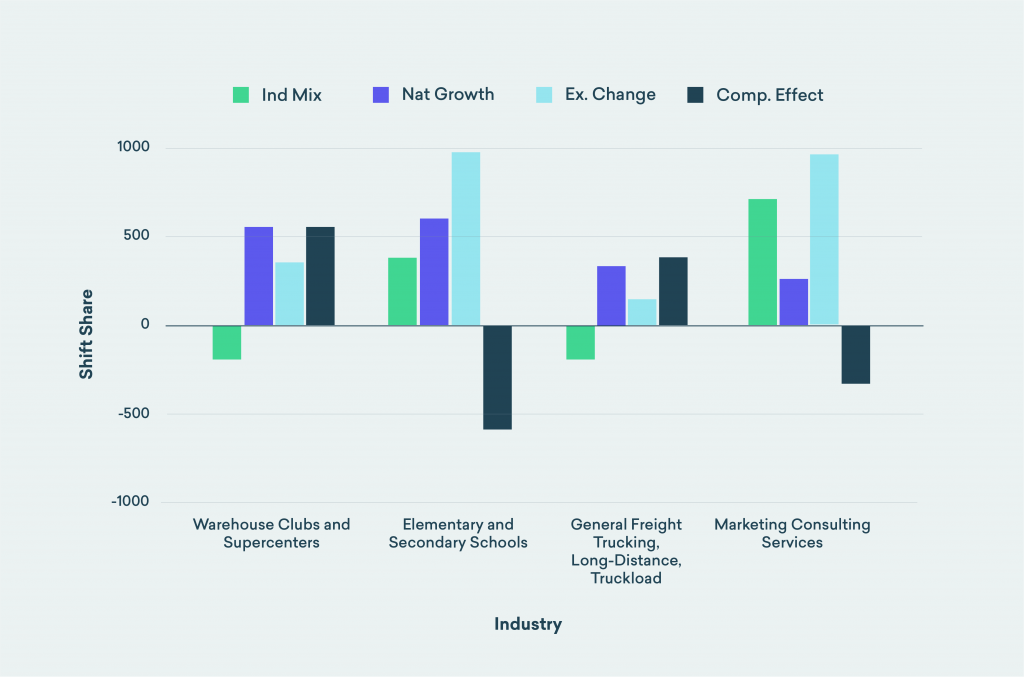
For our purposes, the competitive effect (actual change minus expected change) is the most important. Warehouse clubs and supercenters shows a positive competitive effect, indicating that, in Chicago, this industry is outperforming the national trends (both overall national trends and national trends in that specific industry). Elementary and secondary schools, on the other hand, shows a negative competitive effect, which means the industry is underperforming in the region compared to national trends.
The Boston urban region is a hub for research and development in the physical, engineering, and life sciences, employing over 25K jobs in the industry. Using the Industry Table in Analyst, we can examine the shift share for this industry.Because the R&D industry is declining at the national level, we can predict that it will also decline in Boston (at the regional level) by around 120 jobs. On the other hand, the US economy as a whole is actually growing, which means R&D in Boston should also grow by 394 jobs (see below).To reconcile these numbers, we add -120 to 394 and come up with the expected change: the R&D industry in Boston is expected to grow by a total of 274 jobs.
What’s interesting about this industry at the regional level, however, is that it grew substantially more than was predicted. By looking at the job change below, we can see that 1,459 jobs were added to the R&D industry in the last year. If we subtract the expected change (274 jobs) from the job change, we get the competitive effect (1,186 jobs). This means that out of 1.4K jobs that the industry gained, 1.1K jobs were a result of some unique regional advantage that allowed for the industry to thrive (as opposed to jobs that resulted from national industry growth).

On the opposite end of industry growth in Boston is general medical and research hospitals. Though national job growth predicted 1.5K new jobs in this regional industry, it only gained 507 jobs–less than 1% growth.Though we aren’t able to see the cause of this slower-than-expected growth rate, we can see that it was not caused by national industry or economic trends. By subtracting the expected change (1,596 jobs) from the job change (507 jobs), we can see that the competitive effect of the hospitals industry in Boston is -1,088. So even though the national economy is creating more jobs across the country, there are unusual circumstances specific to the Boston region that are dragging the hospitals industry below the surface.

Using Shift Share Analysis
Shift share is similar to location quotient in that it highlights the uniqueness of a regional economy, but it does so in terms of job growth rather than total jobs in an industry. So shift share, by showing you your region’s competitive industries, highlights your region’s competitive advantages.
It’s important to note that shift share does not indicate why these industries are competitive–that is the job of analysts who have knowledge of local conditions–but merely shows the sectors in that are ahead or behind the nation.
Regional planners, college and university leaders, and others can use shift share to both identify investment targets and either help high-performing regional industries either continue to outperform national trends, or help underperforming industries catch up with national trends so that the regional economy is not left behind in those sectors.
The basic use of shift share is to prevent a hasty and inaccurate interpretation of raw job growth numbers. Here are some ways that shift share can explain a region’s industrial growth:
An industry may be booming in a region, but shift share reveals that the industry is actually growing even faster at the national level, meaning regional factors probably have little influence on the regional boom. Or, shift share may reveal a national decline in that industry, meaning there is a unique regional advantage in that industry that ought to be identified and fostered.
An industry may be declining in a region, but shift share reveals that it is declining even faster at the national level–and thus the regional industry is actually outperforming the nation by stemming job loss. Or, the industry may be growing nationally, indicating that the region faces some disadvantage that is causing localized job loss in a nationally growing industry. If it is significant, this disadvantage should be investigated further.
Notes –
Shift share analysis is mainly used at the industry level, but can also be done at the occupation level. This is because occupational growth/decline tends to reflect the growth/decline of industries employing workers in those occupations.
You can move from industry-level analysis to occupation-level analysis using staffing patterns and inverse staffing patterns in Analyst.
For more information about shift share or Lightcast data, please contact Rob Sentz at rob@economicmodeling.com.


