
More and more, and certainly in light of the current recession, there is a need to apply up-to-date information on local, state, regional, and even national economies to training, curriculum, and skills development. So, in this brief paper we want to show how labor market information (or information on industries, occupations, and demographics) can be used to make program planning more effective and demand-driven.
To make it simple and because there is so much data out there to consider, let us suggest two major data components that ought to play a key role in program evaluation and planning. First, data on the occupations that a specific program trains for gives a college or university a solid framework to evaluate how well it’s staying in touch with local, regional, state, and national demand for that occupation. Second, data on the current availability of those training programs allows educators to see whether anyone else in the region already offers training for those occupations. Looking at occupational data seems too obvious to mention, but seeing it next to data on the actual training programs in the region offers an essential perspective on the program’s viability.
To demonstrate how an analysis like this might work, we’ll look at Larimer County, Colorado.
Let’s say that a college in Larimer County has identified Computer Support Specialists as an occupation it would like to evaluate. Initially we’ll want to look at the occupational data. Historical data from the region looks like this:
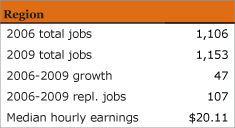
The occupation shows a growth of 47 jobs over the period. However, we also show a strong number of replacement jobs over the period. Replacement jobs are openings that come about due to attrition within the industry. By looking at both of these numbers together, over the 2006-2009 period we see there are 51 average annual openings. This number ensures that we’ll be looking at an apples-to-apples comparison when we bring in the program data for the region.
In this instance, the area colleges have produced zero graduates in the programs that train for this occupation—good news for the school interested in serving the occupation.
Next we’ll pull information on an occupation (Dental Hygienists) that does have training in the region and go a little more in depth on the programs that train for it. In Larimer County the historical data looks like this:
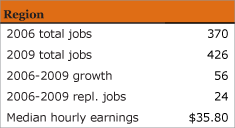
Because those replacement jobs figures are so low, we get an annual openings figure of 27. As we turn to the program data to see how the region will handle these openings we find that in 2008, area colleges produced 35 graduates in programs related to these occupations. So, at first glance, the need for this occupation is already being met by the existing training in the region—and actually creating a surplus of eight grads. However, let’s dig deeper into the program data and look at the award level.
The IPEDS information we’re using to measure the number of completers in the region indicates seven possible award levels: Awards of Less Than 2 years, Associate’s, Bachelor’s, Postbaccalaureate Certificate, Master’s, Doctor’s, and Professional. All of the awards in the region are at a Bachelor’s degree level, which doesn’t necessarily indicate a training need.
Next we’ll look to see the actual programs that train for the occupation:
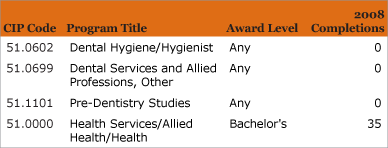
This data shows us that all the registered completions for Dental Hygienists are actually completions in a more general degree, Health Services. While there might be some workers completing a degree in this program and then becoming Dental Hygienists, chances are good that this more general degree does not feed directly into the occupation.
This raises another important issue; even if we assume that some of the annual openings are filled by the Health Services completers, it’s still very likely that a graduate from a program focused on Dental Hygiene would be a much more competitive degree. Completers of that program would require less on the job training and orientation, making them more desirable for employers.
Viewing the program completer data like this helps to orient workforce training efforts, and to understand the viability of a given program in the region. However, there’s one final step—verifying on the ground that this program will succeed. This requires getting in touch with employers in the region. By looking at an inverse staffing pattern on the Dental Hygienist occupation in EMSI’s Economic Forecaster module we can find the industries that staff those workers.

Using this NAICS code we can pull the top businesses in the region—also in Economic Forecaster—under that code and find the employers it would make the most sense to contact. For this scenario the data looks like this:
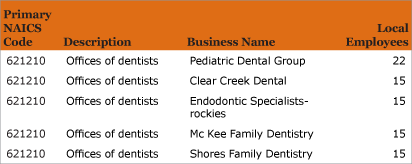
Now we’ve essentially pulled back a list of employers we could contact to confirm the connection between our potential program and workforce demand.
Of course, evaluating any program in any region is going require its own tweaking of this process. If you’d like help performing this kind of program evaluation for your region, contact Josh Stevenson or call 866.999.3674.


