
Where Talent Wants to Be: The 2026 Talent Attraction Scorecard
Eleven years in, we're pleased to share that many regions and states use the scorecard to benchmark their performance against their peer markets. And our 2026 results show no regions are performing better than the Sunbelt and Mountain West.

Josh Wright
Head of Strategy & Growth, Lightcast

How effectively are states and regions attracting talent and growing economic opportunity relative to other markets?
The Talent Attraction Scorecard (TAS), an annual ranking of all 50 states and 925 metropolitan and micropolitan statistical areas, exists to help economic development leaders answer this one fundamental question about their economies.
The 2026 Talent Attraction Scorecard Is Out Now!
No such measure existed when we started the scorecard in 2015, and we’re pleased to see many regions and states using the ranking to benchmark their performance against peer markets. Here’s a quick sampling from a few of our customers who were kind enough to share their use cases:
Greater Phoenix Economic Council uses the scorecard to "show companies and site selectors that the region has the skilled workforce needed to support growth," SVP of Research & Analytics Kristen Stephenson said.
The Tampa Bay EDC uses its TAS ranking "to demonstrate Tampa's competitive talent environment when we are conducting site visits and other recruitment and retention exercises," COO Michelle Bauer said.
For Greater Fargo Moorhead EDC, the scorecard is “one of our top metrics to measure how the Fargo metro is doing in comparison to other markets. Instead of just tracking our progress against internal measures, we know having a third-party validated comparison across markets is important,” President and CEO Joe Raso said.
The 2026 Talent Attraction Scorecard hammers home a consistent theme we’ve seen in recent years: The Sunbelt and Mountain West are where talent wants to be — and where companies are creating jobs. Florida is at the top of the mountain again. Texas, driven by the top two large metros in our rankings, is right there with the Sunshine State as a job-creating juggernaut. Idaho ranks third for the second consecutive year. And don’t forget about Arizona; it’s another powerhouse, and not just because of the Phoenix metro.
As we detailed in our takeaways, the top 10 states, the top 20 large MSAs, and nine of the top 10 mid-sized MSAs are in the Sunbelt and Mountain West. Charlottesville, VA (#9 in the mid-sized category) is the only top-ranking metro that bucks this trend.
But it’s not just geography that dictates results. The best-performing regions typically follow a set of talent development best practices, from focusing on retention first to aligning around labor market demand. In this article, we unpack these and other Talent Attraction Scorecard trends.
"We use the Lightcast Talent Scorecard ranking to demonstrate Tampa's competitive talent environment when we are conducting site visits and other recruitment and retention exercises. It's a talking point that we include in most introductory presentations about our market."

The State of Mobility Today
People are moving less than they used to. That’s the prevailing narrative, and Census data backs that up. But there are important nuances to that story.
Last year, in response to a Wall Street Journal article on declining mobility, we showed that the share of people moving from a different state or from abroad has been quite consistent, according to American Community Survey data.
Updated ACS numbers through 2024 show the share of out-of-state movers has declined a bit but is pretty much in line with the last two decades (2.1% of the population, just below the average of 2.35% since 2006). However, the share of people who moved within the same state has dipped more dramatically since 2006.
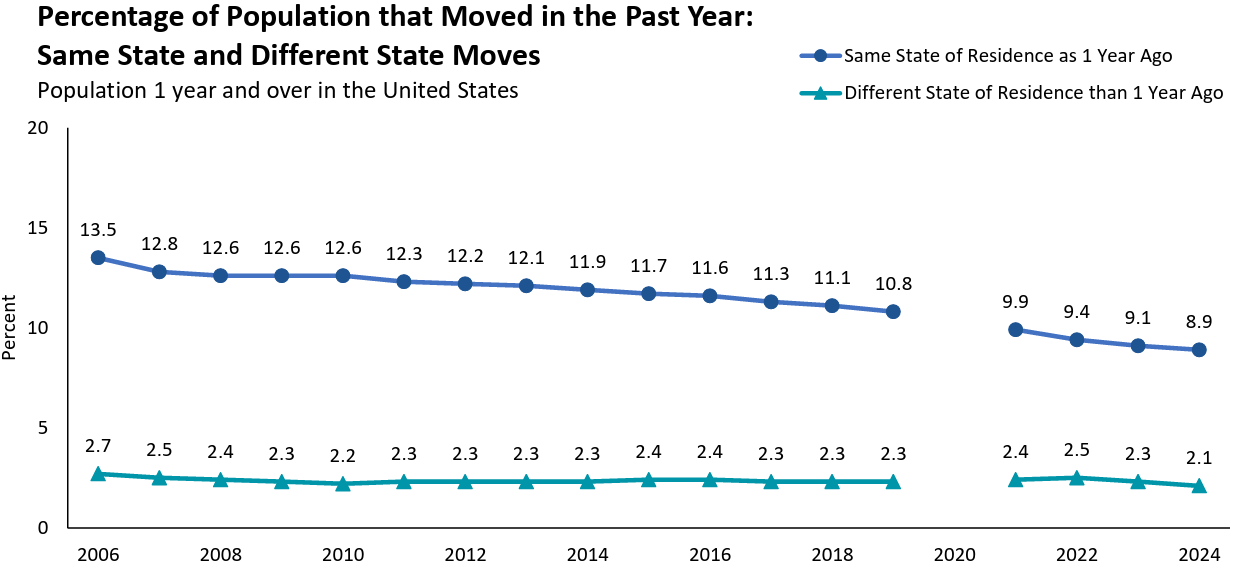
Source: U.S. Census Bureau, 2006 to 2024 American Community Survey, 1-year estimates, Table S0701
Biggest Risers
With fewer people moving, and those who move getting more selective, the stakes are raised for states and regions to compete for talent in this mostly zero-sum battle for people. Who’s emerging amid this battle?
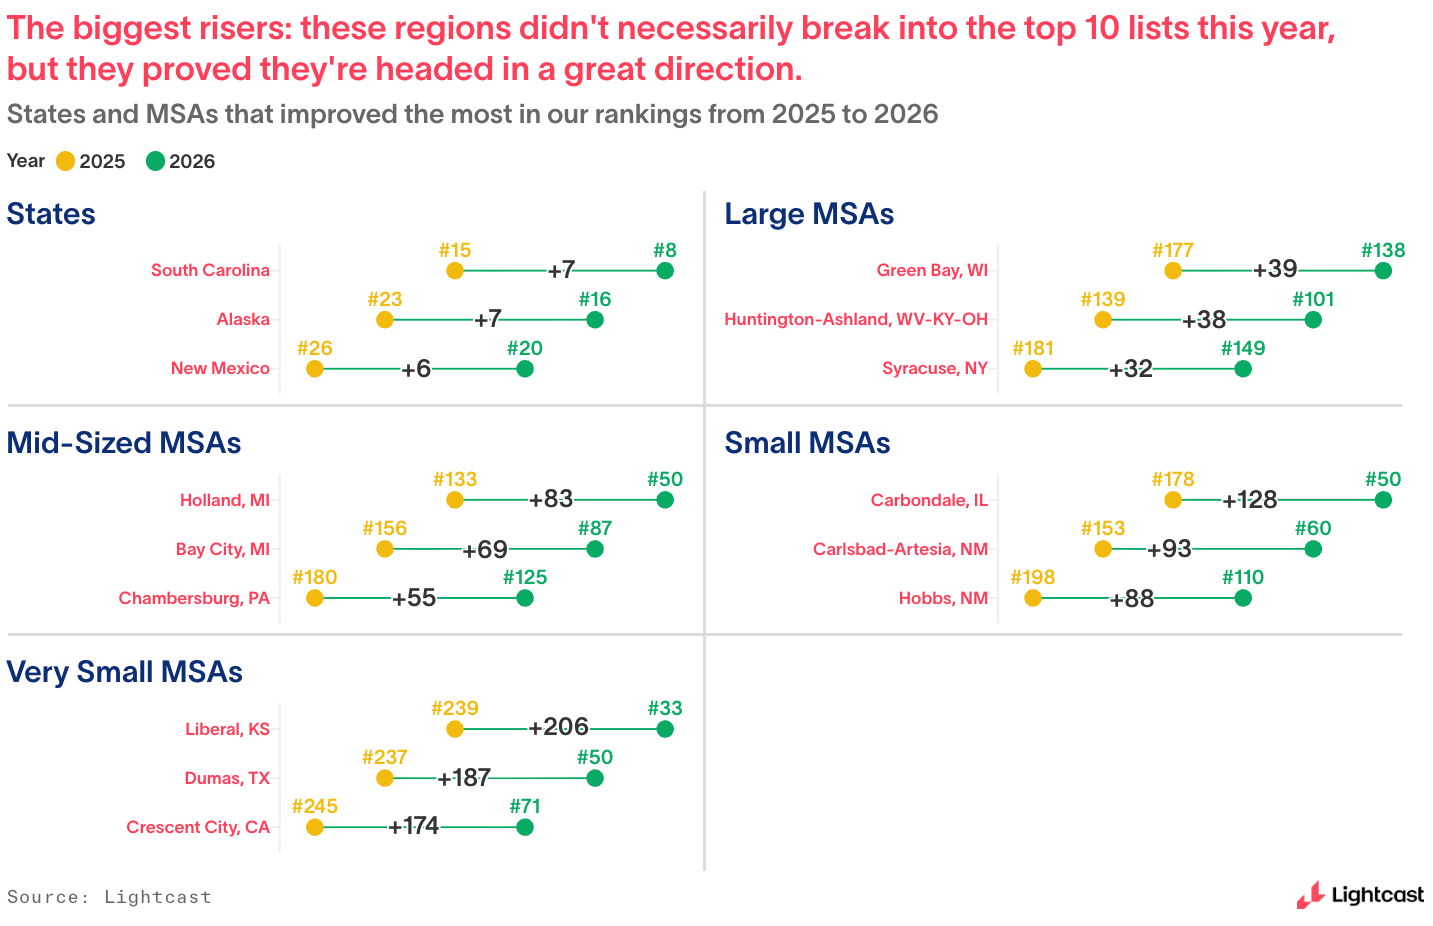
North Carolina (#6) and South Carolina (#8) were the most prominent risers in our 2026 state rankings. Both jumped into the top 10, while Delaware and Wyoming fell out of the top 10. Although lower in the rankings, Alaska and New Mexico also made impressive year-over-year improvements.
Raleigh-Cary, NC, was the biggest riser among large MSAs (those with 250,000 population and above). It vaulted to #3 after ranking 23rd last year. Similarly neighboring Durham rose to 15th this year, showing the strength of the Research Triangle.
Huntington-Ashland, WV-KY-OH, was one of several lower-ranking large MSAs that made big jumps, driven by a major move up in the high-earning job growth subcategory from last year.
Meanwhile, Holland, MI, and Carbondale, IL, made eye-popping jumps. Holland, outside Grand Rapids, showed broad-based improvement across our subcategories to move to 50th in the mid-sized MSA category after ranking 133rd last year. Carbondale made an even bigger jump among small MSAs. It ranked highly in the job growth and prime-age attraction subcategories, perhaps a sign of health for Southern Illinois University, which reported growing enrollment for the fall 2026 semester.
What Austin and Savannah Have in Common
Like last year, most regions leading the way in prime-age (25-54) talent attraction lag behind in blue-collar job growth. But Austin and Savannah are notable exceptions to this trend, signaling they may be in a better position to take advantage of the industrial boom.
Savannah, ranked 21st overall among large MSAs, is #4 in prime-age attraction and #1 in blue-collar job growth from 2019-2025, the timeframe for our 2026 scorecard. Austin, the top-ranked large metro, is fifth in prime-age attraction and 15th in blue-collar job growth.
No other large MSA that ranks in the top 20 in recruiting prime-age works ranks in the top 50 in blue-collar job growth. Metros like Killeen-Temple, TX, Clarksville, TN-KY, and Crestview-Fort Walton Beach-Destin, FL, are bringing in choice talent but not growing their base of technicians and truck drivers, among other blue-collar workers.
On the other hand, the Sunbelt and Mountain West also show up strong for skilled trades and blue-collar job growth because of the industrial investment flowing into these states. In fact, Idaho is #1 for blue-collar job growth, followed by Arizona, Utah, Nevada, and South Dakota.
The Common Ingredients
Eleven years in, the Talent Attraction Scorecard — nicely complemented by DCI’s Talent Wars survey research — paints a clear picture. The states and regions that consistently perform well in our rankings have geographic advantages, sure. But they share other common ingredients, too. They think long-term. They drive new business investment. They focus on retaining the talent they have, first and foremost. They care deeply about quality of life, safety, and other community attributes. And they start with a foundation of data and research.
Explore the 2026 Talent Attraction Scorecard.
Recent Posts

It’s Scary That AI Might Give You Bad Data. It’s Terrifying That You Might Believe It.

Highest Tool and Die Workers’ Salaries in the US
