
Workforce data visualizations: interactive, customizable, beautiful.
Create compelling data visualizations while we take care of hosting, maintaining, and updating your no-code, embeddable dashboards.
Amplify your work with eIMPACT™
In today's data-driven business landscape, quick access to insights is crucial. Enter eIMPACT™: revolutionizing workforce data visualization with a streamlined solution for creating captivating dashboards -- without the usual technical hurdles.
Combine your workforce data with the industry's most comprehensive and accurate external labor market data for unmatched insights.
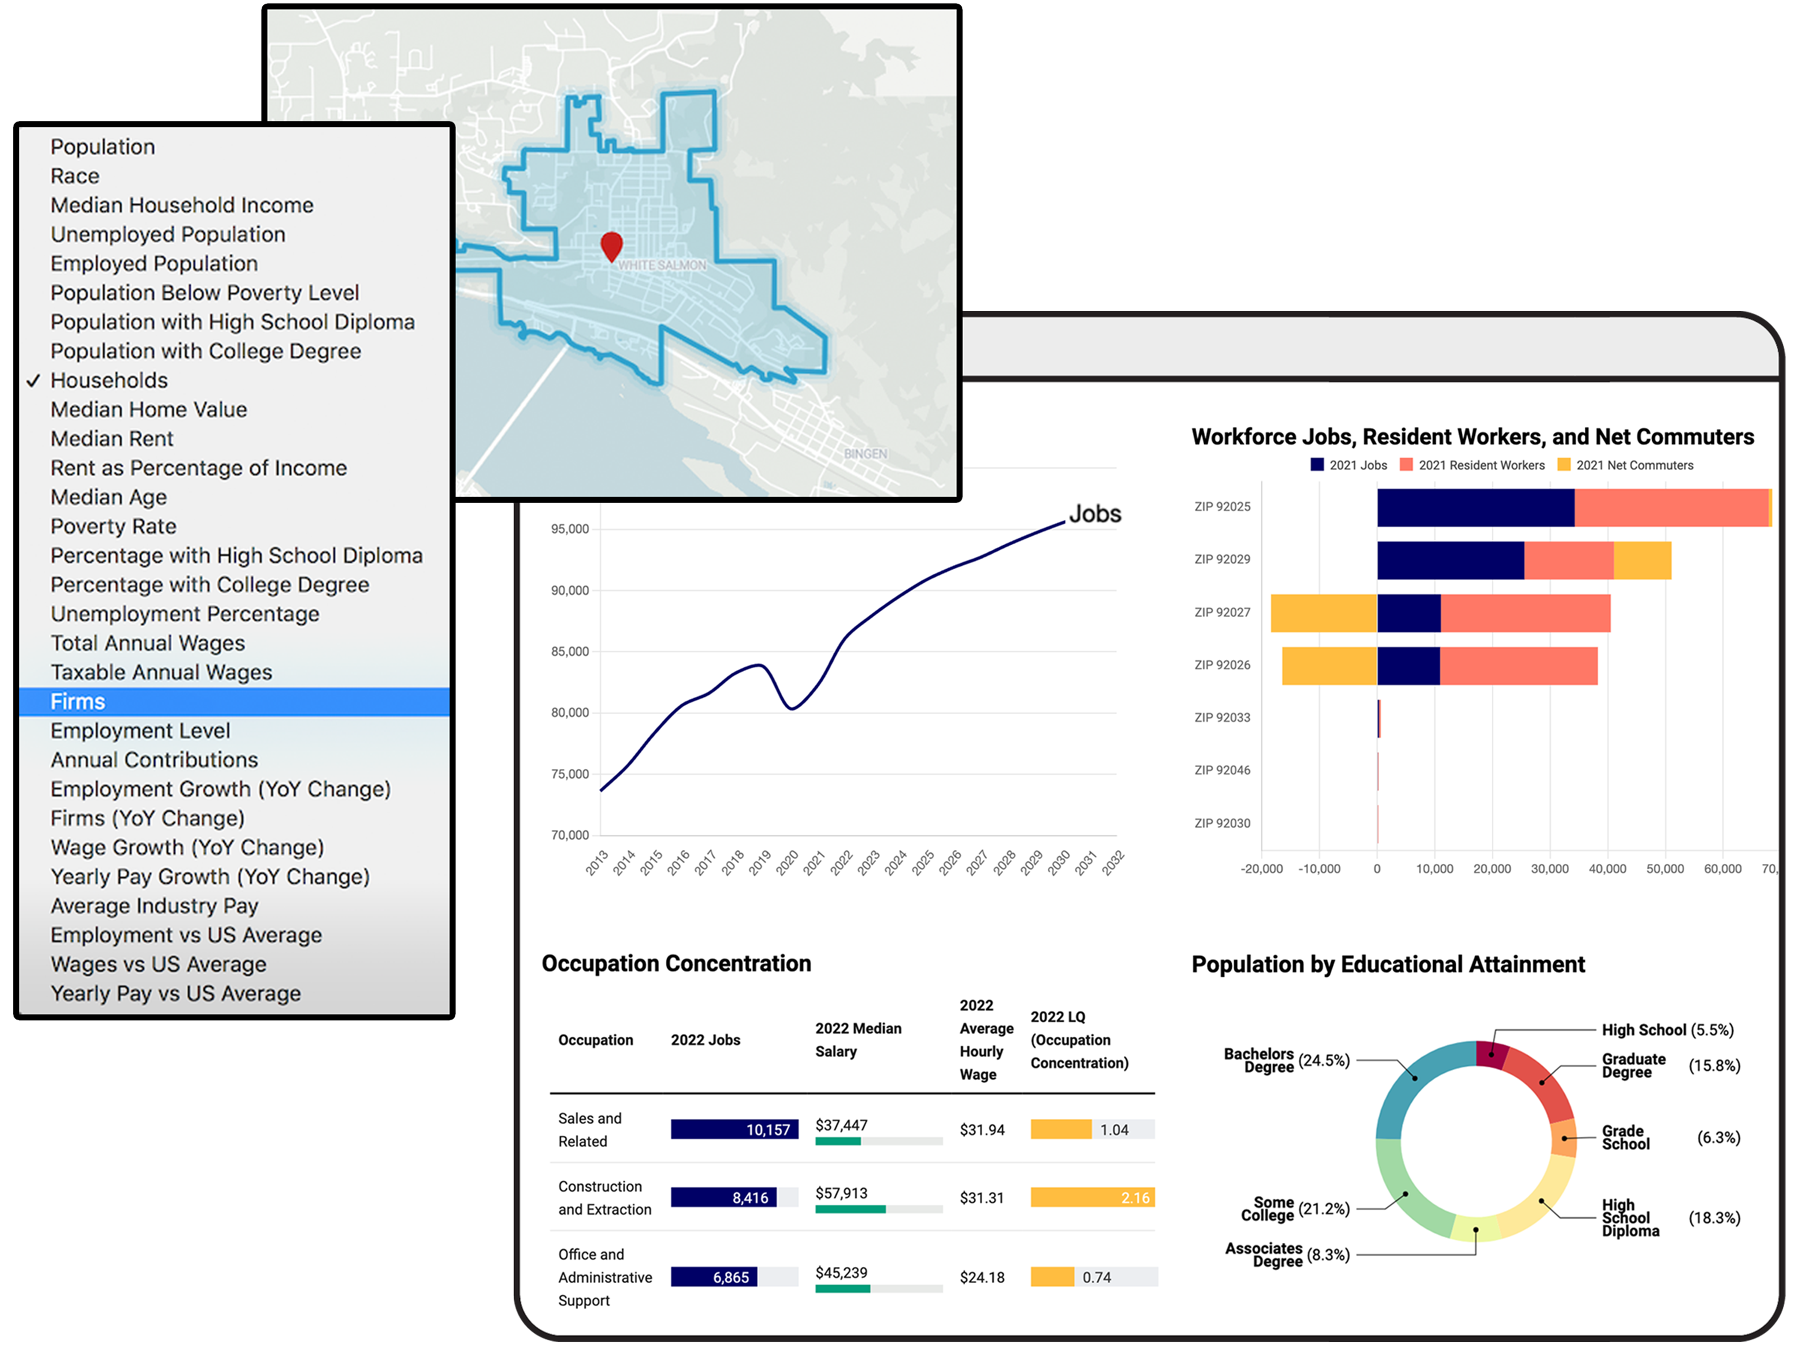
Make data accessible with engaging visualizations for clear data-driven decisions.
Streamline data inputs (and/or use optional third party integrations) so your dashboards are always up-to-date.
Transform raw data into embeddable dashboards with a "no-code" solution in less than two weeks.
Steps to success
See eIMPACT™ in action.
Baylor University's dashboard offers a comprehensive solution for data visualization and storytelling, providing educators and administrators with insights into program outcomes, hiring demands, and skills sought by employers. eIMPACT™ dashboards highlight the success of alumni outcomes, making it simple to track enrollment trends and institutional growth. All data—whether from Lightcast or third-party sources—is easily accessible in one centralized platform. Scroll down to interact with a real-world example of Baylor University's implementation.
Get a customizable, public-facing dashboard that tells your story.
Speak with an expert today!