Education providers have millions of futures on their hands. While their goal is simple - to deliver positive outcomes for their students - the journey to reach it is one of resilience and adaptation .
With ever-changing market and economic conditions in the UK, the importance of understanding labour market trends could not be any higher.
The only way to get ahead is to understand how to best prepare students for an often unpredictable workforce, and be responsive to market needs. This requires research, and research requires reliable data sources. Looking at what other institutions are doing may help - but it won’t provide you the full picture of labour market trends in your area, across all universities and employers.
What is labour market information?
Labour market information is data regarding all aspects of the workforce and its trends, including employers, talent profiles, job postings, skills, salaries, and industry trends. From the moment job postings are published online - with their respective date, employer name, job description, skills requirements and benefits packages, to the moment candidates share their online profiles or resumes, all of this data generated can be gathered to create relevant insights. Plus, employers may also report data to government sources, which is then made public.
At first glance, this is an overwhelming amount of data, and gathering the insights you need (think, for instance, finding out what is the most in demand skill employers are looking for in your region), can be like looking for a needle in a haystack. On top of that, these numbers can change quickly, so if you have a solid picture of employer needs now, this data may well be outdated in a few weeks, resulting in inaccurate insights and poor decisions.
The graphic below breaks down the different components of labour market information. As we mentioned, some of these change often, like skills data, but others, such as industry trends, are reported quarterly or even annually, so you don’t see substantial differences often. You can see these categorised as “real-time” and “traditional” data below. The pyramid shape shows more granular data at the very top, and it becomes broader as we get to the bottom.

Foundational data: traditional labour market information
The traditional labour market information doesn’t change often, so you have a solid base to work on and from which to gather insights. However, because it is considerably extensive, it doesn’t give you the granularity you may need to understand the specificities of your labour market. Instead, it provides a full picture of all the different industries and occupations, including location, and wages.
Industry
The Office for National Statistics (ONS), a statistical department reporting to the UK parliament, uses Standard Industrial Classification of economic activities (SIC) codes to classify industries. This is a five digit classification that enables ONS to collect and publish statistics regarding economic development across industries.
These classifications are also grouped into broader industry sections, making it easier to navigate through the extensive list of codes. For instance, Section R represents Arts, entertainment and recreation, while section P represents Education. Industry data is crucial to determine employment numbers in each sector and how these have changed over time.
Occupations
The ONS categorises occupations by Standard Occupation Classification (SOC) codes. These codes are four-digits and enable the ONS to understand employment trends in the UK, including the demand for specific occupations and their salary ranges.
Occupation data can be used to understand the types of jobs available to students after they graduate, the most popular occupations in your region, salary trends and career prospects within specific roles. This is crucial to help students understand the labour market, define their career plans and get into employment after they graduate.
But this isn’t enough data for education providers to understand the specificities of each role and the skills they require. Plus, they need to be aware of the latest trends in order to adapt to them promptly. That’s when a time series of near real-time labour market information comes into play.
Times series of labour market information
Our near real-time labour market information is collected from hundreds of millions of job postings and provides a level of granularity that can’t be found in traditional data. The labour market moves fast, so you need the most current data possible to drive valuable insights. However, clear trends can only be spotted over a longer period of time. That’s where a time series visualisation of data can help - enabling educational institutions to define labour market trends over months or years, and adapt their internal and external strategies accordingly. Labour market information can be divided into four subcategories: employers, occupations, profiles, and skills. Let’s explore each further.
Employers
This includes every organisation that has active job postings, whether they be a public or private, or profit or non-profit organisation. Employer data is important for the Higher Education sector because it enables education providers to discover the top employers in the area, top employers for a specific job title, or even companies to partner with. This data can be particularly useful for student careers services, in guiding students through their potential employers and which companies to look out for.
Specialised Occupations
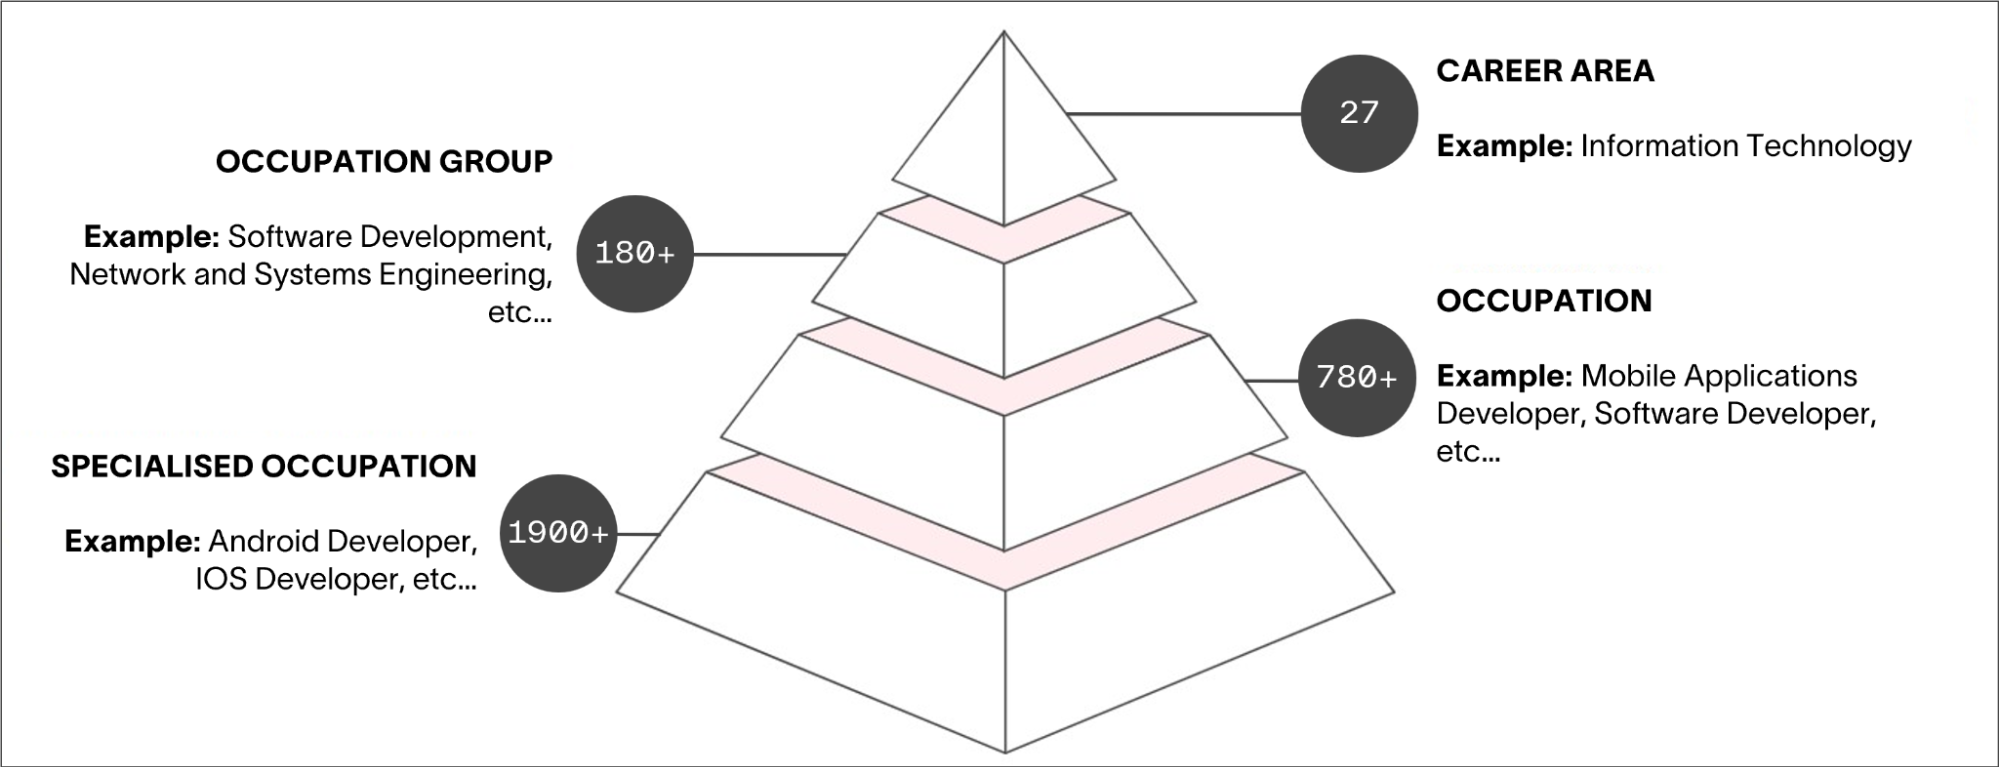
We have mentioned Occupations earlier, but Specialised Occupations is a recent addition to our Lightcast Occupation Taxonomy (LOT), which adds an extra level of granularity to the Occupations category. It is much more detailed and includes particular skills or areas of expertise.
For example, for the broader Software Developer Occupation, Specialised Occupations could be Android Developer or IOS Developer. As we can see in the below image, our LOT has over 780 Occupations, and over 1900 Specialised Occupations you can use to define detailed career pathways.
This is highly important for two main purposes. Firstly, you can use this granular data for porfolio review and planning: reviewing your current courses and making sure they cover the right skills for specific jobs, boosting your students’ employability. You can also discover emerging roles in your regions, the type of skills workers may be looking to learn, and understand how a role can overlap between degrees programmes, such as IT and Finance.
Secondly, you can use this data to show candidates and students their potential career paths, and how your courses can help prepare them for their dream career. This can help drive recruitment for potential candidates, but it can also improve career guidance for your current students. For more on this, check out how Lightcast helped the Careers and Employability team at The University of Melbourne guide their students through career planning.
Profiles
Online profiles include important data about employees, such as their skills, education and job history, or residence. While at first glance it may not seem as relevant to education providers as it is to, for instance, companies that are actively hiring, this data can actually be very helpful.
Profiles data can help you understand what your alumni have been up to after graduation, the types of skills they list in their profiles, how that matches the skills you are teaching and, also, how to forge better connections between alumni and employers.
Skills
Last but most certainly not least, we have skills. In a skills-driven labour market, this category is arguably one of the most important for education providers. Skills are competencies, expertise or abilities that employers are seeking - anything from knowing how to work with a software tool, to speaking a unique language. There are common and specialised skills, too: common or soft skills refer to more personal attributes, whereas specialised skills refer to specific knowledge or expertise in a topic.
You can use skills data to review your curriculum plan and make adjustments according to the skills employers are looking for, but also to market your courses to your target audience, and to improve your career services - making sure you boost employability for your students.
You may also find data through surveys, such as alumni surveys conducted by your institution, which provide you with more qualitative insights that big data sources cannot.
Now we know all the different types of labour market information and how you may use it to improve courses and processes, but one big question remains: where are you going to find all these different data points?
Find the labour market information you need
All of the data we discussed is available online, but you can’t analyse millions of jobs postings or profiles by yourself. Here are some of the options you can consider:
Governmental sources
The ONS produces and publishes reports on various labour market topics, including industry trends, regional economic growth, employment statistics, and employee earnings. This data is available online and free of charge. Yet, you do need to keep in mind that it isn’t real-time, and often not very granular.
API or Data Connectors for your management dashboards
With an API (Application Programming Interface), you can pipe data directly into your own software or web application and gain much more flexibility. Data Connectors can link data held in the cloud to management dashboards running on platforms like Power BI or Tableau.
Lightcast offers an Open Skills API which enables you to access our skills library of over 30,000 skills collected from hundreds of thousands of job postings. These are split into 400 subcategories so you can easily navigate your way through the library and find the skills you are looking for. This API allows you to upload course data in bulk and index it by skills, enabling sophisticated skills-level curriculum management.
As well as making our data available via APIs, Lightcast’s data tables are accessible in the cloud-based direct database system, Snowflake. Data Connectors between Snowflake and platforms like Power BI make the integration of Lightcast data with other datasets possible.
Software
If you’d rather not set up your own API, there are software platforms that aggregate and clean the data, and present it in software such as a research portal. Lightcast’s Analyst is a user-friendly platform that covers all kinds of labour market information, from industries to occupations and skills. It also covers all geographic levels, including national, regional, LEP and Local Authority, and presents the data in an intuitive and accessible way, so that any department can easily draw insights from it.
Display tools and widgets
If you want to share relevant labour market information with your students or partner institutions, you can also get an interface that can be embedded into a web page. Lightcast has worked with various education providers and national bodies to develop easy-to-navigate platforms that are highly customisable and interactive. For example, you may want to show your students who are the top employers in your region for each sector, or how much they could be earning if they were to get a particular role.
Consulting services
Sometimes unique challenges require unique solutions. If you have a specific goal and don’t want to invest in a tool just yet - you can also look for consulting services. Lightcast offers bespoke consulting services to cover many specific labour market challenges and goals, from horizon scanning to identifying opportunities for new courses.
Make the most of labour market information
Labour market information is an essential part of strategic conversations in today’s education environment. It can be used to answer many questions that educators, boards, and cabinets will be discussing (not to mention prospective students and their parents). By connecting education and work, you have the tools to craft a bright future for your institution and your students. Let’s get started?