
Welcome to the Letter from the Chief Economist.
Before we get into this week’s economic news—and you don’t need me to tell you there’s been plenty—I want to dive into remote work once again. Last week, I shared the WFH (Work from Home) Map, a new tool based on Lightcast job posting data, which has interactive charts and downloadable data on the rise of remote work. It was based on the working paper “Remote Work Across Jobs, Companies, and Space” by Stephen Hansen, Peter John Lambert, Nicholas Bloom, Steven J. Davis, Raffaella Sadun, and myself .
Last week my focus was on the map, and how its data are available to download so others can explore our findings further. Today, I want to look closer at the paper itself, and two nuanced findings worth spending some time with.
First, our estimates of jobs that offer remote or flexible work are lower than the estimates coming from other research that studies how many people are actually working from home (one example would be WFH Research, also a Nick Bloom and Steven Davis project, which released new survey data this month estimating that close to 30% of all workers are remote).
There’s a good reason for that: it’s far more likely that someone who was hired for an on-site role might eventually go remote than it would be for someone hired for a full-time remote role would change course and go to the office five days a week. It’s far easier to imagine a company letting a local employee stay home a few days a week than it would be to relocate a remote employee to an office.
So when you apply our findings, remember we’re studying job postings and not the number of workers, but also keep in mind that our statistics would be on the lower end of the total impact of WFH.
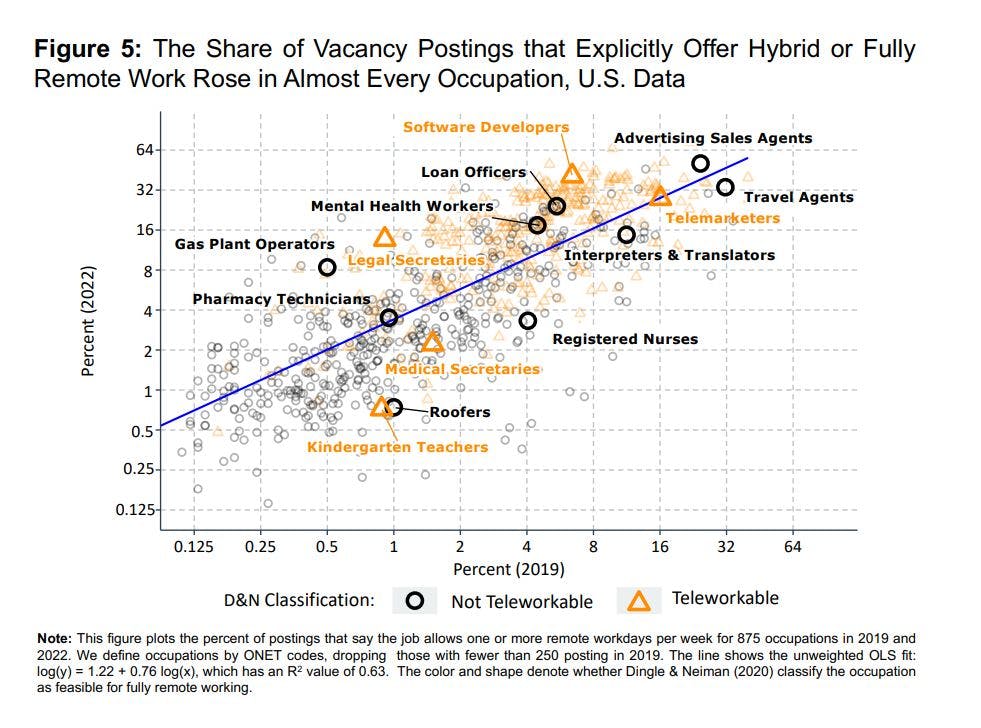
That said, our paper still shows that impact in considerable detail. A useful point of comparison is the paper “How Many Jobs Can be Done at Home?” (Dingel and Neiman, 2020) which came out in the early days of the pandemic and sorted many occupations based on whether they provided a viable teleworking opportunity. Our paper is generally in line with theirs, as we can see here when comparing remote jobs between 2019 and 2022.
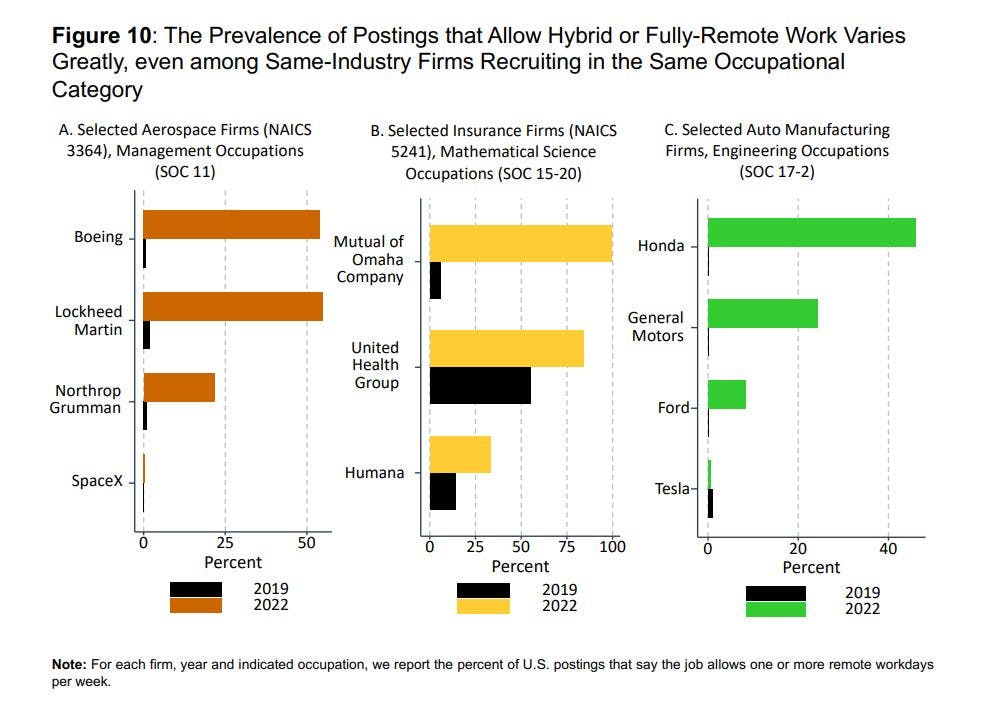
But we can also look closer now than they were able to three years ago. The main difference is that Lightcast data offers firm-level variation, which you cannot see in O*Net data, and this is valuable because sometimes businesses doing very similar work might have a very different approach to WFH. The chart below shows this—among engineers at auto manufacturers, there’s been a large increase in the share of employees now working remotely. But one firm, whose CEO has been outspoken about having employees work in the office, has actually seen its share of remote workers decline. I call it the Tesla effect.
Economic News
Let’s begin with employment numbers: on Tuesday in the UK, the Office for National Statistics reported that job vacancies decreased by 51,000 to a total of 1,124,000 in the quarter covering November 2022 to January 2023. This is the eighth consecutive period that job vacancies have dropped in the UK, but they are still at elevated levels compared to the pre-pandemic period. Some of the hardest-hit industries were Manufacturing (-9,000), Information (-9,000), Professional scientific activities (-8,000), and Construction (-7,000). Despite the decrease in job vacancies, the unemployment rate in the UK remained almost unchanged at 3.7%, still at historically low levels.
Returning to the US, Friday’s Employment Situation report for February showed a strong gain, with 311,000 jobs added in February. Although the unemployment rate ticked up to 3.6%, it is still at historically low levels. Moreover, the prime-age Employment-Population ratio and the Labor Force participation ratio increased for the first time to pre-pandemic levels.
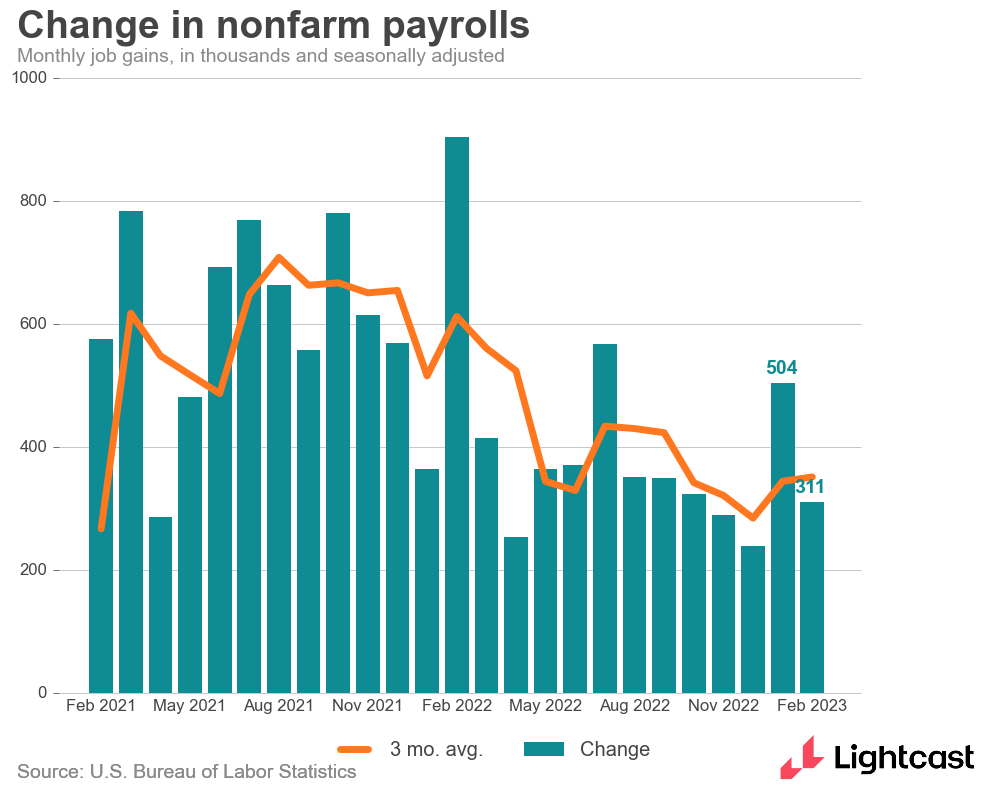
I was very encouraged by those numbers, especially seeing most of the negative effects of the pandemic reach their end. It also helped contextualize the drop in job openings we’ve seen in JOLTS: openings are decreasing not because companies want to hire fewer people, but because they’re filling positions quicker, and that, in turn, is due to more people joining the labor force and fewer people quitting. That’s what we want to see in a well-balanced labor market.
Elsewhere in the economy, the Consumer Price Index (CPI) rose 0.4% in February (seasonally adjusted), reaching 6.0% over the last 12 months (not seasonally adjusted). This was in exact line with expectations, and slightly below January’s inflation level at 0.5%.
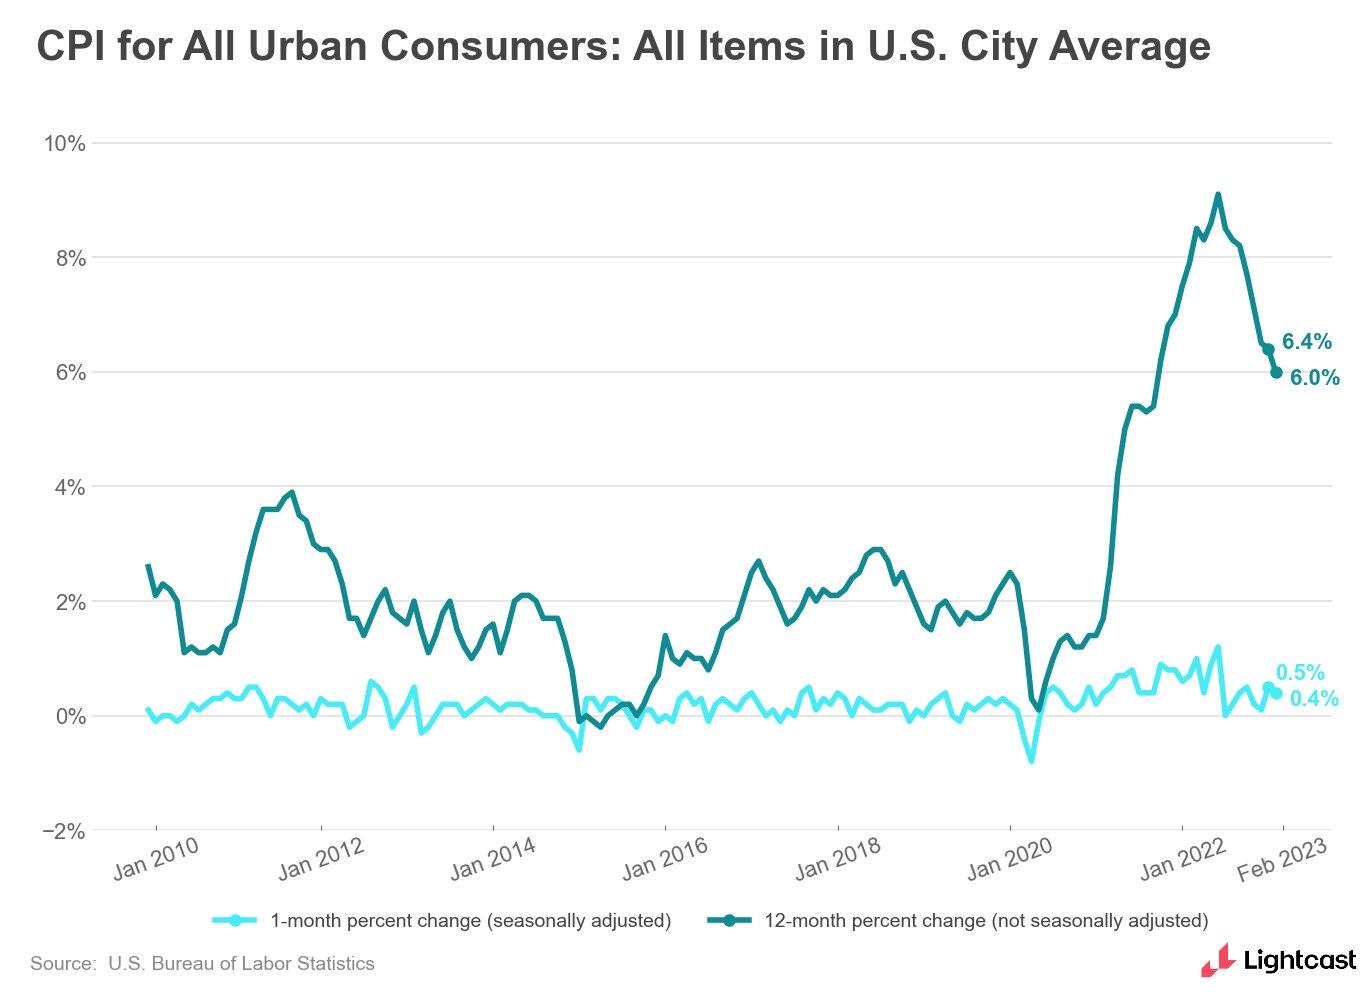
Looking at specifics, core CPI (all items less food and energy) rose 0.5 percent in February, a tick up from the 0.4% we saw in January. That number was mostly driven by an increase in shelter costs, and that’s concerning because once rents go up, they tend to stay up—much harder to adjust than, say, groceries.
At the same time, this has been the slowest increase in the overall CPI since September 2021, and that’s good news for the Federal Reserve as it aims to bring down inflation. And on Wednesday, we got even better inflation news: wholesale costs, measured by the Producer Price Index, actually fell in February, even though a rise of about 0.3% had been expected.
Finally, the big news. I don’t know if you’ve heard, but Silicon Valley Bank and Signature Bank failed last week, and Credit Suisse was on the ropes until getting a $54b lifeline from Switzerland’s central bank.
On Twitter, I saw a great video about a bank in the 80s that survived a run by having its tellers work very slowly in order to limit the number of withdrawals—then once a lifeline of cash arrived, they worked very quickly so that nobody who came into the bank would see a line. It was nice to consider those simpler times, because that’s not what happened at these banks, where the runs were fueled by panic on social media and in group texts.
About the failures themselves and the banks’ misjudgment of economic trends, I’ll defer to economists who specialize in that kind of analysis. On Monday, Erica Jiang, Gregor Matvos, Tomasz Piskorski, and Amit Seru came out with a paper that summarizes the situation well: “Monetary Tightening and U.S. Bank Fragility in 2023: Mark-to-Market Losses and Uninsured Depositor Runs?”
For the labor market, I think the most relevant consideration is what all of this means for interest rates when the Fed meets next week. After a strong jobs report and mostly positive inflation numbers, we might have been looking at a 0.5% increase. But the bank failures have made everyone nervous, and there’s now very little appetite for risk and new ventures. That’s essentially the goal of higher interest rates, and if it’s happening anyway, then higher rates might not be in the cards. The Fed doesn’t want anything else to break. So instead of a 0.5% increase, we’re probably looking at 0.25%—and zero increase is within the realm of possibility.
We’ll find out next week. Until then,