Developer is one of our most powerful tools, designed to help understand local economic strengths using labor market and demographic data. We are consistently making improvements and here are just a few of the exciting new updates to that platform.
Industry Snapshot
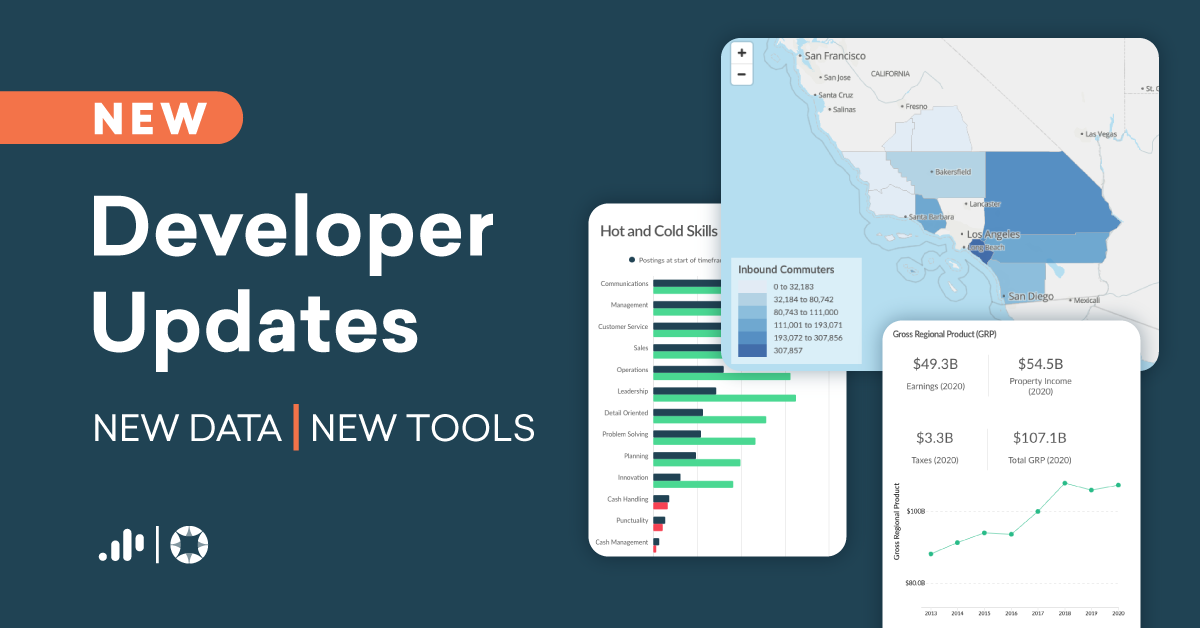
The Industry Snapshot, revamped with new data and visuals, is better than ever. This report now allows users to get even better information in an easier way. Two standout new features are the Gross Regional Product and the Unemployment Rate Trends. For the first time we provide an analysis of a region’s overall earnings, property income, and taxes over time to provide a historical look at the growth of your region. With ongoing concerns regarding unemployment, Developer provides a means to track your community’s unemployment trend over time and by industry. It allows your organization to be more responsive to market demands and adjust strategies using more accurate and up to date information.

(Data: Los Angeles MSA)

(Data: Los Angeles MSA)
Commuting Map
With the Commuting Map feature live, you can now access point-to-point commuting data for your region. This includes inbound and outbound commuters and provides a net commuter number. You can also look up this information via zip code, allowing a very granular look at commuting patterns.

(Data: Los Angeles MSA)
Hot & Cold Skills Report
This is a brand new report to allow a community to swiftly identify the “hot” skills of their region by providing an overview of the largest increases and decreases of skill postings over a certain period of time. Right now there are 9.5 million people unemployed and yet there are 10 million job openings. This report helps communities and jobseekers pinpoint the skills needed to fill those openings. To aid workforce organizations in this work, we’ve also just launched SkillFit (link), a tool designed to help case managers identify their client’s skills and help them gain better employment or necessary training—all based on skills.

(Data: Los Angeles MSA)
Occupation Demographic Report
The new Occupations Demographic Report has been one of our most user requested features. With this new dataset and report we are able to showcase the demographic breakdown of every occupation. Below is a table containing a list of various occupations for the Los Angeles MSA. We can divide the data by age, gender, race, ethnicity, and even identify historical trends.

(Data: Los Angeles MSA)
Final Thoughts
In order to provide the most relevant and usable data we’re always improving Developer and our other tools to better serve communities and these are just a few of our most recent updates. If you have questions about these new functions or have a dataset you’d like to see, please reach out to us.
Sign up for our newsletter below, we’d love to connect!


