For data to be useful, it needs to be accurate. Imagine you’re trying to open a new business and you need to decide which city you want to open it in: you’re going to want to know as much as you can about the locations you’re considering.
Government labor market data is a valuable tool for making those kinds of decisions. It can provide you with information on occupations, industries, demographics, and long-term trends at the state and regional level. It’s extremely important to utilize proper and accurate labor data when doing analysis, because incomplete data can lead to poor decisions that hurt businesses and the local economy.
Unfortunately, data sourced directly from government agencies, like the BLS, BEA, and Census Bureau, is often incomplete. That’s because these agencies are required to use data suppression to limit how much of their survey data they can disclose.
Data suppression refers to the various methods or restrictions that are applied to survey data in order to limit the disclosure of information about individual respondents and to reduce the number of estimates with unacceptable levels of statistical reliability.
But where statistics agencies are limited, Lightcast can provide answers.
Why Suppress Data?
In order to craft beneficial policies, ensure efficient use of resources, and improve quality of life for everyone, governments are constantly collecting and publishing data about their constituencies. At the national level, the government agencies releasing data most relevant to the labor force are the Census Bureau and the Bureau of Labor Statistics (BLS).
One of the most useful and popular publications that the BLS releases is the Quarterly Census of Employment and Wages (QCEW). This dataset is composed of employment and wage numbers (as well as establishments) for industries across the United States. The data are rolled up into various hierarchies at both the industry and geographic level. For instance, in 2023 the manufacturing industry at its highest level (i.e. a two-digit NAICS code level) had 77,806 employees in the state of Idaho. At that same two-digit industry level, Ada County, Idaho’s most populous county, had 19,393 jobs in the manufacturing industry. The manufacturing industry can then be broken out into more specific categories, showing us in much more detail what kinds of businesses those 19,393 workers are employed in.
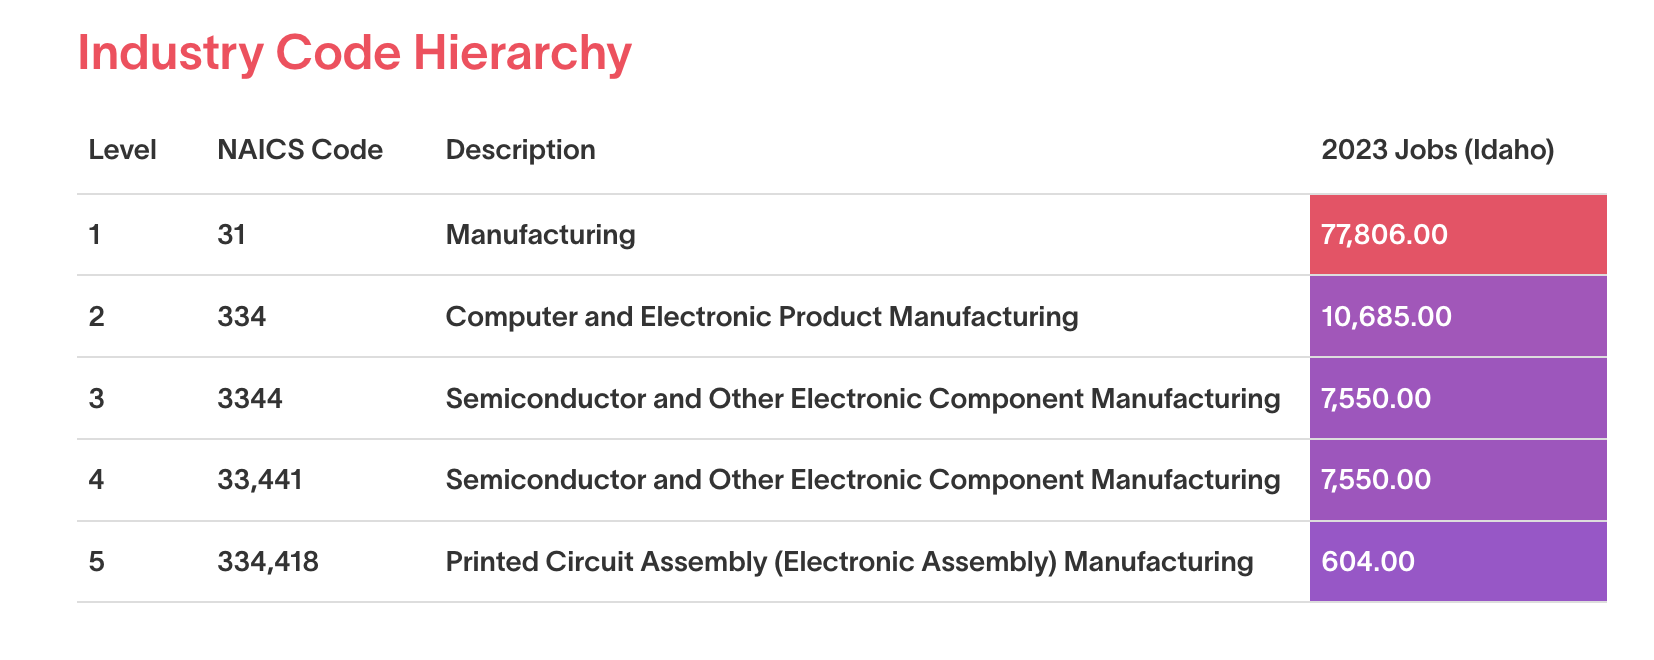
NAICS = North American Industry Classification System.
Data Source: Lightcast QCEW Dataset, 2024.4 Data Run.
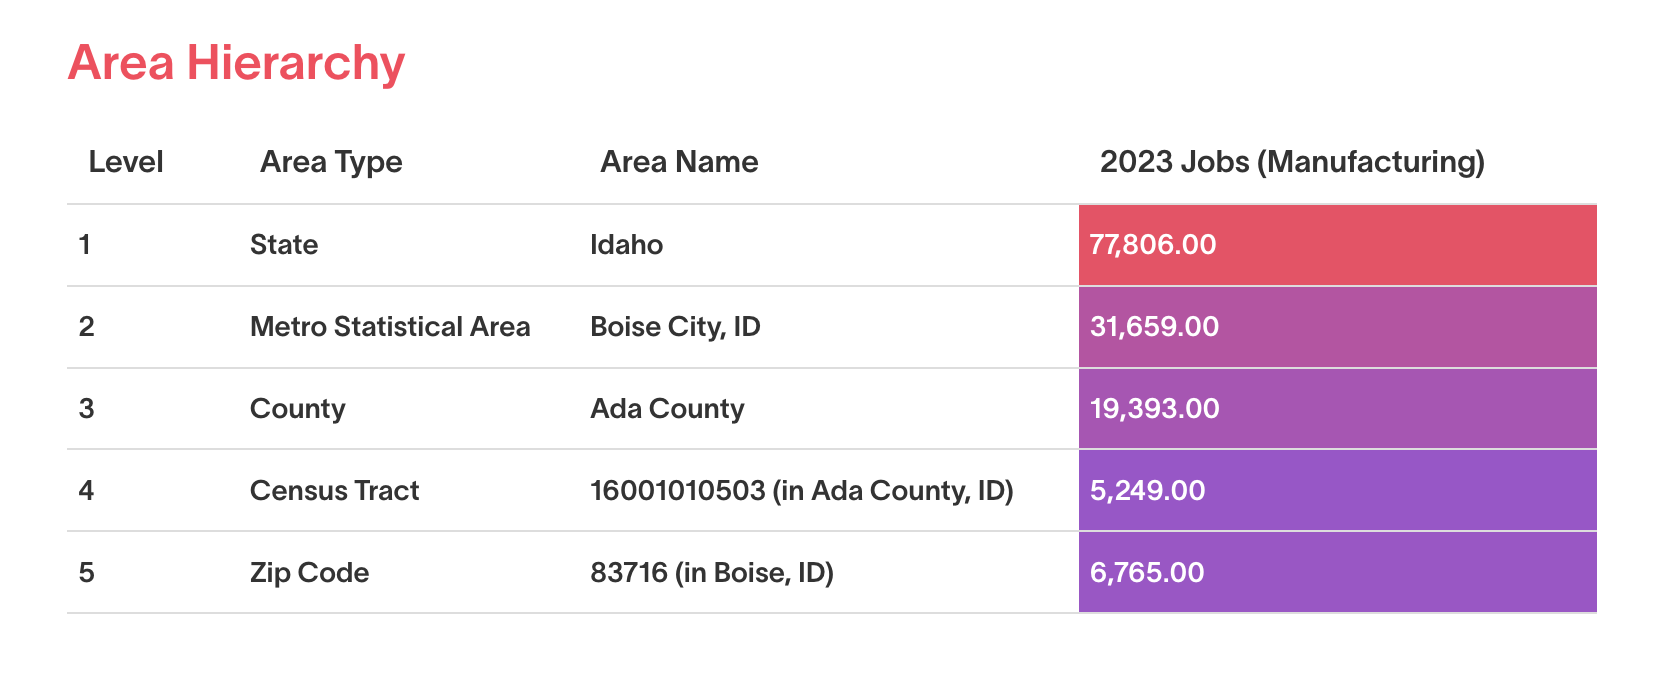
Data Source, Lightcast QCEW Dataset, 2024.4 Data Run.
However, the US government also has a legal obligation to protect the rights of its citizens and their private information, such as household earnings.
For example, in a small county, what if there are less than 10 people employed in an industry where the number of establishments and the average wages are published? Not only would you have competitive information on the firms in that region, but the wages of individual people would be exposed. Anyone would be able to assess the financial situation of your friend Bob who works at a local business—which would not be fair to Bob.
Therefore, if certain thresholds aren’t met, the statistics agencies won’t publish the data they have.
But it’s not just the data from small industries that get suppressed. In many regions across the US, there is a single employer who is the lifeblood of an economy; an individual manufacturer or service provider that employs hundreds of people, and everyone in the region is familiar with it. Even more importantly, they are the only firm in that industry operating in the region. In that case, it would be easy to estimate the exact employment and wages of a given firm, providing proprietary business intelligence to anyone willing to look for it.
In these situations, the firm’s employment and wage numbers would be suppressed. In fact, if at most three firms in a region employ 80% or more of an industry’s employees, the entire industry’s data would be suppressed. While well-intentioned, this suppression hides valuable insight from anyone seeking an accurate understanding of the region’s economy.
So in summary, if any given region has
1. An industry has 10 employees or fewer; or if
2. Three firms employ 80% of an industry or more;
then the BLS suppresses this information. This looks like giving the industry a mark (most often the letters “NA” or for the Census, just an asterisk), signifying that the non-data in the fields do not mean zero, but that there is data there and they are not providing the specifics.
Incomplete Data Means Inaccurate Decisions
One of the most powerful indicators used by researchers is historical trends; without them, researchers cannot see how we arrived at a point in time, or what it might mean for the future.
In Q2 2023, QCEW data set contained over 3,046,426 data points related to private firms. Of those data points, over 60% were suppressed. That means only 1,215,453 of the original 3,046,426 data points are publicly available.
Beyond the sheer lack of data, the greatest challenge posed by suppressed labor market information emerges when researchers start trying to analyze regional trends.
Let’s assume that the economy experiences some turbulence. The large firm we mentioned earlier has some competition moving into their region, and at the same time, closes one of their facilities, laying off thousands of their employees. The data changes from one primary firm employing over 90% of the industry to four firms all providing a relatively even portion of industry employment.
If looking at the data year-over-year, a researcher or model might assume a spike in employment, because BLS data now shows, say, 400 people employed in an industry where previously, it showed none (due to data suppression). What the researcher or model could not know was that thousands used to be employed in that industry, albeit at only one firm. What looks like a spike in employment is really a great loss, not only to the employer, but to the entire community.
This might seem like a fantastical story, a small exception to the rule. But in fact, this is a real-world situation that happens every year in communities across the country.
The good news is that you don’t have to stake millions of dollars and years of your organization’s time on incomplete information. There is a solution.
Is Unsuppression Possible?
Using a proprietary algorithm, Lightcast has unsuppressed QCEW and other government statistics estimates down to the 6-digit NAICS level for over 20 years. And to take things even further, Lightcast applies an anti-suppression method at the levels of Census tracts, ZIP codes, and even at the individual city level. This means that data, whenever present, is available at the most granular industry and geographic level possible. With this level of precision, researchers, community leaders, businesses, and education providers are making decisions with data that they can be confident in.
If Lightcast data could be traced back to specific individuals, it would violate the same privacy principles that prompt the government to suppress its data. But because Lightcast provides more complete industry and occupation data, everyone can rest easy knowing their personally identifiable information is not available—and yet everyone using the data can be confident it tells the most complete story possible.
Lightcast believes there is a story to be told with data, and if the right data can be put into the right hands, growth and prosperity will result. To understand why Lightcast unsuppresses data, you need to remember that for data to be trustworthy and impactful, it must tell a complete story. Stories are built on details, and to tell an accurate story, it is necessary to have access to the most comprehensive, reliable data available to make better data-driven decisions for policy makers.
To learn more about the current state of the global labor market and the trends that are shifting the ground beneath everyone's feet, check out our latest research, Fault Lines.