
Since 2010, the Denver-Aurora-Broomfield MSA has gained nearly 100,000 jobs — a growth of 7.5% from its lowest point during the recession and nearly 4% growth since 2007, before the crash. According to Brookings Metro Monitor, Denver now ranks 33rd for overall recovery from the recession and 15th for employment specifically. So which industries are driving this job growth, and what are the fast-growing occupations that staff these industries?

Source: QCEW Employees, Non-QCEW Employees & Self-Employed – EMSI 2013.4 Class of Worker
Driver Industries
To find Denver’s driver industries, we used Analyst (our online labor market tool) to filter for the industries with notable growth, earnings, and concentration (i.e., specialization or uniqueness in a particular region, stated in terms of location quotient). The results? Ten industries that together have grown by 16% and added 17,000 new jobs since 2010:
NAICS CodeDescription2010 Jobs2013 JobsChange% Change2010 National LQ2013 National LQ2013 Avg. Earnings Per Job5413Architectural, Engineering, and Related Services26,46729,4913,02411%2.092.15$108,0425511Management of Companies and Enterprises23,61426,4022,78812%1.391.37$185,0695416Management, Scientific, and Technical Consulting Services15,95918,2182,25914%1.361.31$86,8235182Data Processing, Hosting, and Related Services4,7946,4511,65735%2.132.61$122,4405239Other Financial Investment Activities8,1169,7431,62720%2.132.28$132,2456223Specialty (except Psychiatric and Substance Abuse) Hospitals (Private)4,5646,1351,57134%2.472.97$69,8325411Legal Services14,90816,4111,50310%1.221.3$102,4752111Oil and Gas Extraction5,5086,7751,26723%3.753.65$209,9425191Other Information Services1,5772,37780051%1.181.32$91,3292379Other Heavy and Civil Engineering Construction1,0301,50947947%0.981.33$68,768Source: QCEW Employees, Non-QCEW Employees & Self-Employed - EMSI 2013.4 Class of Worker
Three industries stand out with the most impressive track records. Oil & gas extraction leads the way in concentration (3.65 LQ — down slightly from 3.75 in 2010 but still more than 31/2 times the national average). It has grown 23%, added 1,267 new jobs, and offers the highest annual wages with an average of $210,000 per job. The specialty hospitals industry has the second highest concentration (2.97 LQ) and has grown 34% with 1,571 new jobs. Annual wages average at $70,000 per job. Data processing, hosting, and related services also has solid concentration (2.61 LQ) and has added 1,657 new jobs and grown 35%. Annual wages are high at an average of $122,440 per job.
Speaking of wages, a number of industries pay better than the rest of the nation. For example, compare oil & gas extraction’s $210K to a national average of $180K:

Compelling Occupations that Drive Industry Growth
Now let’s look at the occupations that are spurring on the growth in Denver. Below, we’ve taken the chief occupations staffed within each of the 10 driver industries and illustrated their often remarkable effects on the MSA as a whole.
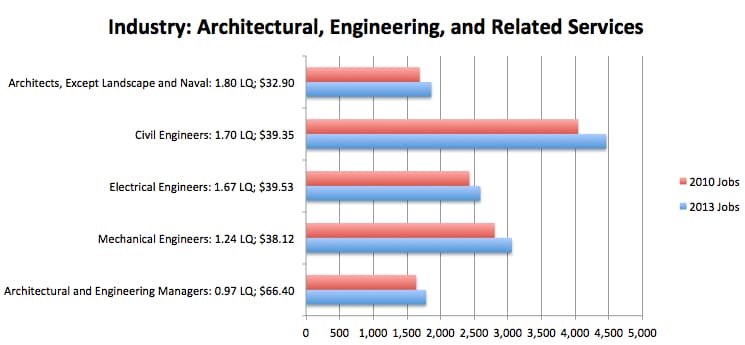
Architects (except landscape & naval) have the highest concentration (1.80 LQ). Not surprisingly, architectural & engineering managers have the highest wages ($66.40). Civil engineer jobs stand out for their growth (10%, over 400 new jobs) and for the interesting fact (not shown here) that 74% of all civil engineers in Denver are staffed within this industry.

The high concentration (2.70 LQ) for business operations specialists shows that it is another compelling occupation for the Denver area. Another curiosity not shown on the chart is the fact that while auditing and accounting jobs have grown a modest 8% in the MSA, they’ve spiked nearly 20% within this specific industry.
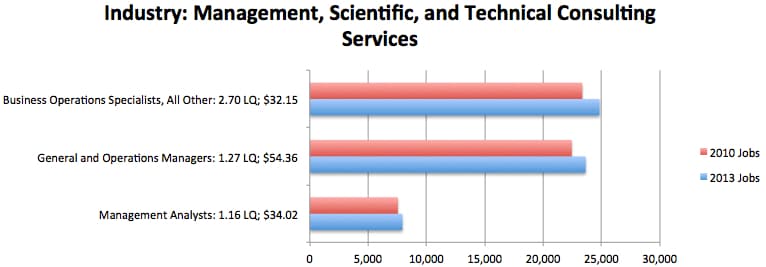
Business operations specialists are propelling this industry as well.
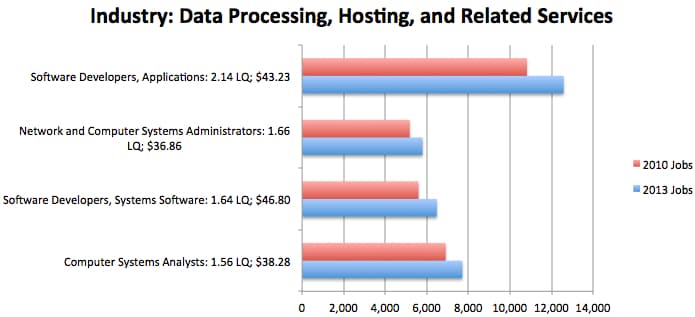
Within this industry, application software developers have seen the most growth (16%, over 1,700 new jobs) and also have the greatest concentration (2.14 LQ).

Securities, commodities, and financial services sales agents have the highest concentration (1.91 LQ), while personal financial advisors have the most impressive overall growth (15%, 500 new jobs).

Nobody’s jaw drops to see the growth in registered nurses (6%, over 1,300 new jobs). Biological technicians have the most robust concentration on this chart (2.71 LQ), though their wages ($20.61) are the lowest of these occupations.

This is something of a rare picture for the U.S. right now. No, the growth of lawyers and the like hasn’t been stratospheric, but compared to the rest of the nation’s 50 largest MSAs, Denver is looking pretty fit. These four occupations have collectively grown 9% and added over 1,500 new jobs the past three years, whereas MSAs like New York, Sacramento, Buffalo-Niagara, and Cleveland have actually lost a fair number of jobs.

The story here, of course, is geoscientists, what with their growth (19%) and wages ($50.73) — plus just look at that concentration (4.49 LQ).

Cream rises: here are application software developers once again.
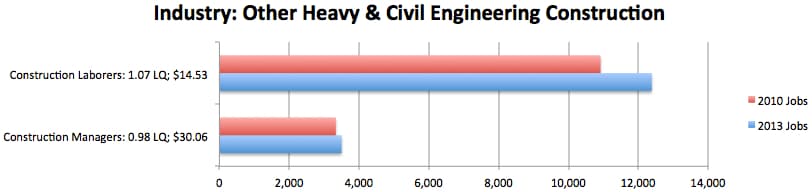
Construction labor obviously doesn’t pay as well as construction manager positions ($14.53 vs. $30.06), but the occupation has nevertheless seen some pretty decent growth (13%, almost 1,500 new jobs).
Conclusion
So, in the end, the standout industries and occupations have been fairly predictable for Denver; after all, the oil & gas industry has been growing just about everywhere it can, and registered nurse occupations really aren’t going away. The curveballs have been things like the legal jobs, which could be good news for that surplus of lawyers out there.


