
Last week we looked at how skill clusters provide an enhanced understanding of a job. By looking at a region through the lens of skills–which adds a real time layer to occupation and industry data–communities are also able to better identify talent strengths, opportunities, and gaps based on supply and demand.
For example, when a company or industry says it needs more engineering talent, there is more to it than that. Specific domain experience, skills, and knowledge are needed. Even within an occupation title, say mechanical engineer, there are skills that differentiate one job from the next. Thus building a strategy to address a general bucket need for “engineering talent” won’t do. Skill clusters provide the needed granularity to determine the supply and demand of the core skills which make up a role.
Looking again at San Diego as an example, the graph below reveals the supply and demand of clusters within engineering. The X-axis is the demand for architecture and engineering skill clusters from job postings. The Y-axis is the supply of that cluster from resumes and profiles.
Behind each of these clusters is the collection of core skills discussed last week that define the role.
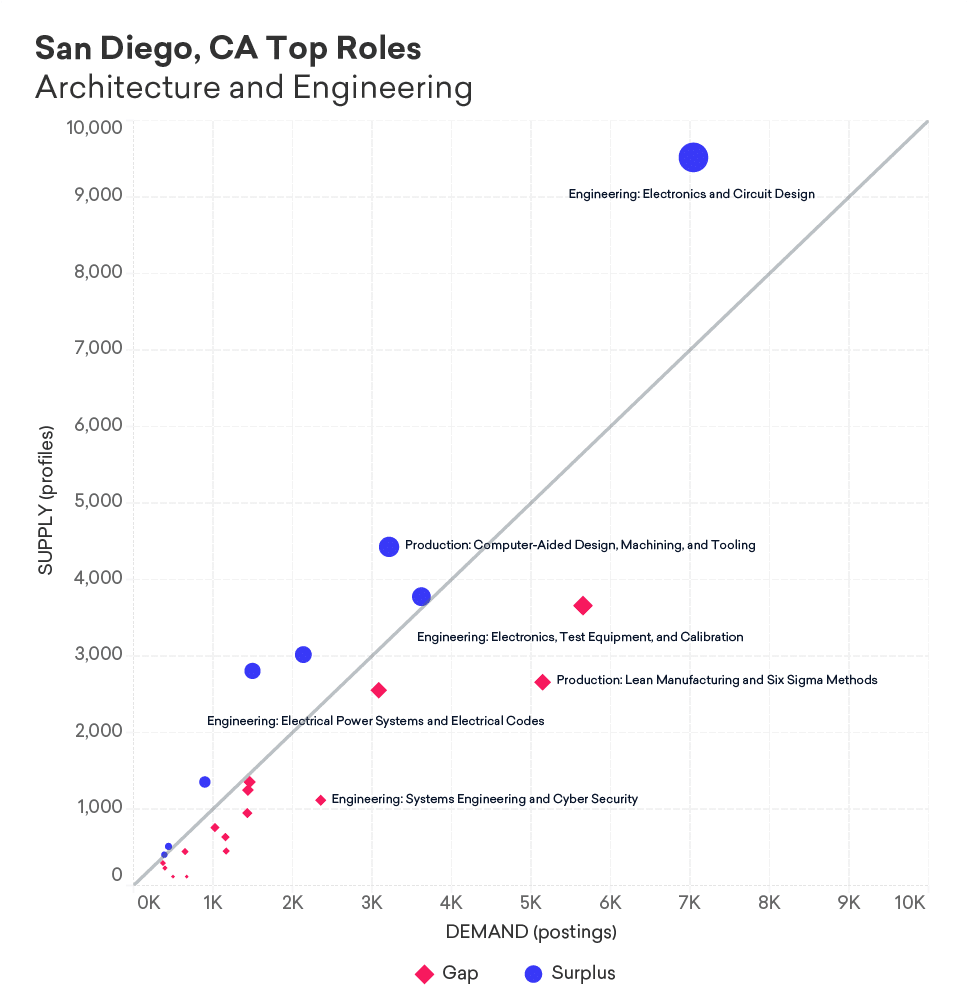
Within the architecture and engineering cluster in San Diego, a real time view emerges of the skills employers are needing. With the trend line representing equal supply and demand, skill clusters such as lean manufacturing and six sigma methods reveal upskilling and talent development opportunities (high demand with low supply). While clusters such as computer-aided design, machining, and tooling, reveal possible business attraction opportunities, as a surplus of talent exists (lower demand with high supply). Clusters provide a much needed granularity and visual depiction of a region’s talent topography.
A step further: regional comparisons
With the above information, communities can also benchmark their skill clusters against those of peer regions. Cluster data puts a region’s workforce under a microscope and better reveals regional differences. Within the same industry, regional talent strengths and needs vary across the country. Each region has a unique composition of employers requiring particular skills.
The map below shows the different makeup within manufacturing of three regions. Each indicator represents a discrete skill, with the color signifying the type of skill, such as engineering or IT/math. The size of each indicator reflects the importance of the skill with respect to its regional skill cluster.
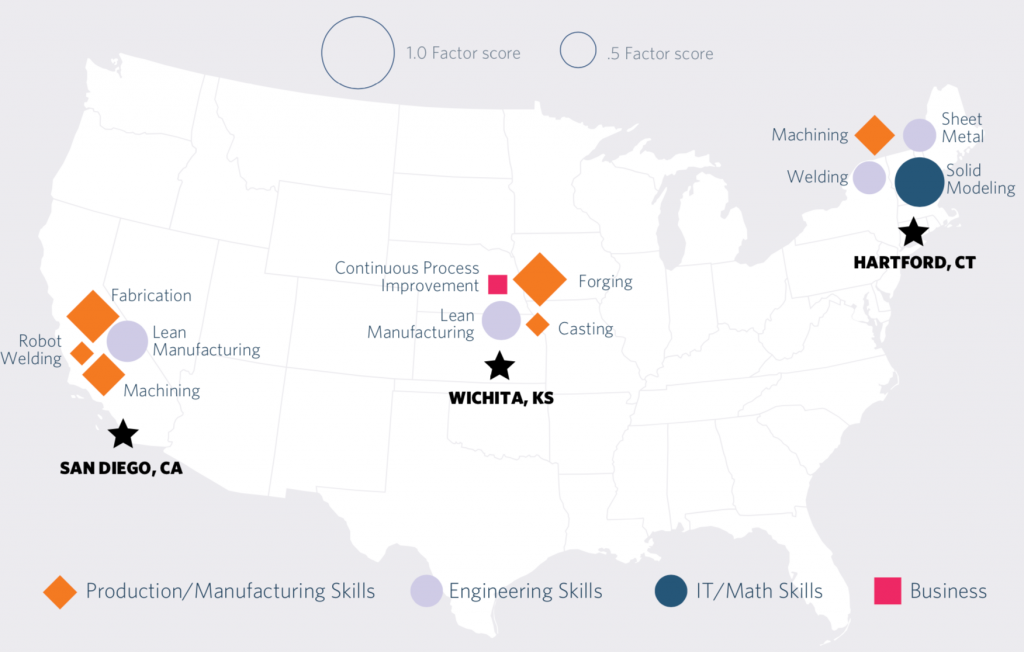
So while San Diego, Wichita, and Hartford all have manufacturing industries, the skills which define each region are very different. When attracting businesses or talent, or developing workforce programs to fill gaps, knowledge of a region’s skill clusters are vital to know how to direct efforts.
Why this is important
Emsi Skills provides real time information on the push and pull occurring within a labor market. Coupling this information with trends and benchmarks derived from traditional LMI gives communities a truly comprehensive picture, allowing them to determine what differentiates them from other markets. And as a region’s supply and demand of labor shifts, skill clusters give economic and workforce developers, educators, and businesses the ability to be more prescriptive than reactive in the adjustment of programs and strategies.
We’re using skills data to help communities think differently about the talent challenges they’re facing. To discuss putting this data to work in your community, contact Josh Wright at jwright@economicmodeling.com.


