
In early 2000s, self-employment was on a rapid ascent in the United States. The number of Americans working on their own — those who consider themselves self-employed, not just freelancers doing side jobs — increased 4 percent annually from 2001 through 2005, and then grew 2 percent from 2005 to 2006. But then the early signs of the downturn began to appear, followed by the financial crisis and Great Recession, and self-employment growth came to a halt. New jobs of any kind became scarce, and even when employers started hiring post-recession, self-employment didn’t recover. Only since 2012 has there been positive growth, albeit slight.
We documented self-employment trends before and after the Great Recession using EMSI’s dataset on self-employed workers. These are workers who, when surveyed by the U.S. Census Bureau, consider self-employment to be a significant part of their income or time working.
Key Findings
For all the talk about more people wanting the independence of working on their own, self-employment jobs have declined 5 percent since 2009. The U.S. has an estimated 10 million self-employed jobs, nearly one million fewer than it had in 2006. By contrast, the number of jobs for salaried employees — those who work in traditional work settings — has risen 4 percent since 2009.
The decline in self-employed jobs coincides with a rise in Americans working on the side to supplement their incomes. More people are getting second and third jobs, but fewer people are dropping their day jobs altogether to work on their own. 20 percent of full-time workers picked up a second job in 2013 or plan to do so in 2014.
The biggest declines in self-employment have come in the farming and agriculture, construction, real estate, child care, and retail trade industries. The biggest gains have been in lower-wage fields — photographers, landscaping workers, maids, and personal care aides.
Even with low-wage occupations at the top of the self-employment growth list, several high-wage occupations have made significant gains, most notably computer occupations such as web developers, market research analysts/specialists, and management analysts.
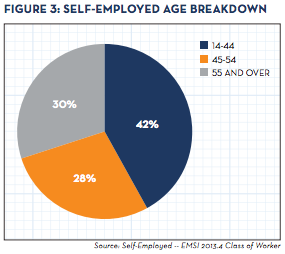
Nearly two-thirds of self-employed jobs in the U.S. are taken up by men (62 percent), and more than 30 percent of the self-employed are 55 years and older.
Only North Dakota and Washington, D.C. have seen self-employment increases since 2009, and their gains have been minimal (5 percent and 1 percent, respectively). Among large metros, only five have seen at least 2 percent growth in self-employment jobs: Memphis (4 percent), Bridgeport-Stamford-Norwalk (3 percent), Austin (2 percent), Orlando (2 percent), and Las Vegas (2 percent).
Definition and Data Sources
EMSI’s self-employment dataset is based largely on the Census Bureau’s American Community Survey, which EMSI combines with our other proprietary data and other publicly available sources. This dataset tracks proprietors who work for their own unincorporated business, practice, or farm. People with incorporated businesses are considered wage-and-salary workers for their own companies, and are thus not considered proprietors.
While not included in this study, EMSI also tracks what we call “extended proprietors” — those who do side gigs or earn income through a sole proprietorship or partnership, most often (but not always) in addition to their primary job. If surveyed, they would not list this extra work as their main source of income.
This report uses EMSI’s 2013.4 data release.
Monitoring Entrepreneurial Activity
EMSI’s proprietor datasets offer a window into entrepreneurial activity for any level of geography, but we caution against labeling all workers in the self-employed or extended proprietor classes as entrepreneurs. More accurately, inside the extended proprietors dataset are those who pursue extra work opportunities while maintaining their day job, while the self-employed dataset includes those who have taken the additional step and earn a significant part of their income through their own business. Once start-up owners incorporate their business, they fall under EMSI’s traditional wage-and-salary worker datasets.
National Trends
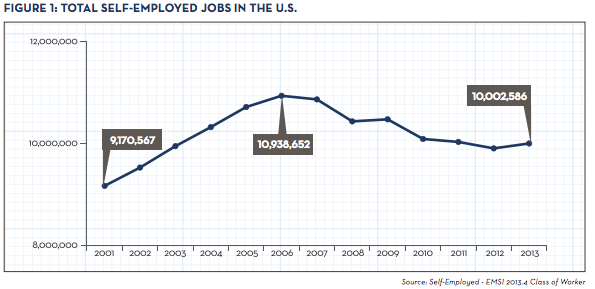
The U.S. has an estimated 10 million self-employed jobs. That’s 6.6 percent of all reported jobs, down from a high of 7.2 percent in 2006. A far larger percentage of workers hold freelance jobs or work on the side in some fashion in addition to their primary job (e.g., performing music on the weekend, coaching their child’s youth sports team, mowing lawns or doing other yard work in the summer). Freelancers Union estimates that nearly a third of the labor force are independent workers. Yet due to the limitations of publically available data from the government on proprietors, it’s difficult to pin down the exact share of the workforce who do side jobs versus those who earn income in partnerships and other ventures that aren’t necessarily jobs in the strict sense.
What’s clear, however, is that the number of workers who consider themselves self-employed is declining after a period of sustained growth. From 2001 to 2006, the self-employment workforce rose 19 percent – close to 1.8 million new jobs nationally. But since, the U.S. has lost 936,000 self-employed jobs, a 9 percent decrease.
Economic forces like the credit crisis and housing bubble either soured people on self-employment or made it harder for them to start and sustain their own businesses. No industry bears this out more than construction.
During the growth days of the early 2000s, construction was the biggest driver of new jobs among the self-employed. Even with a small decline during the 2001 recession, the construction industry, fueled by the housing boom, accounted for nearly 1 in 4 new self-employment jobs (418,000 total) from 2001 to 2006. Much of the jobs gains, however, have been wiped out since the downturn. Self-employed construction jobs dipped 13 percent from 2006 to 2013, a loss of 266,000 jobs.
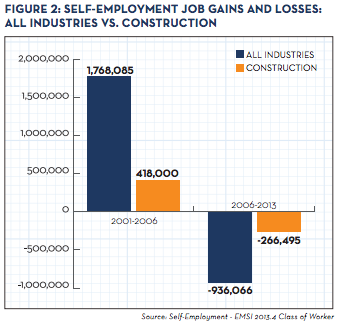
Just as construction made up almost 25 percent of all new jobs during the boom period for self-employment, it has accounted for 28 percent of the jobs losses since. However, not every field inside the sector is bleeding jobs. For instance, self-employed jobs for construction laborers (as shown in Table 1) have expanded 10 percent since 2006. On the other hand, construction managers have declined 38 percent over that time. Based on these trends, there could be a comparable rebound in construction self-employment if the
housing recovery kicks into full gear.
Beyond construction, the biggest declines in self-employment have come in farming and agriculture, retail trade, and real estate. Jobs for self-employed real estate agents have dipped 22 percent since 2006, from approximately 317,000 to 246,000. And the drop-off in self-employed farmers and ranchers has been even more substantial — a 38 percent decline in jobs, which equates to 93,000 lost jobs.
The largest gains, meanwhile, have been among “managers, all other,” a catch-all management occupation, and three lower-wage occupations: landscaping workers, maids, and personal care aides. Nonetheless, several high-wage occupations have also seen solid self-employment growth, most notably computers occupations such as web developers (up 67 percent since 2006), as well as market research analysts/specialists and management analysts.
The largest self-employed occupations are childcare workers (516,000 jobs), maids and housekeeping cleaners (437,600), and farmers, ranchers, and other agricultural managers (437,000). Carpenters and construction laborers are also common self-employed occupations.
Among high-skill occupations, the largest self-employed fields are ones that lend themselves to people starting their own firm or office – lawyers (184,000 jobs), management analysts (158,000), and accountants and auditors (107,000). Of those three occupations, only management analysts have grown since 2006 (3 percent) while lawyers (-10 percent) and accountants (-13 percent) have seen double-digit percentage declines.
Table 1 shows the performance of high-skill occupations, and occupations with the most growth and decline among the self-employed.[1] One occupation that stands out: medical transcriptionists. Self-employed jobs in this field have shot up 375% since 2006, from just over 2,300 jobs to more than 11,000 nationally.
TABLE 1: TOP AND BOTTOM GROWTH SELF-EMPLOYED OCCUPATIONSHIGH-SKILL FIELDSDescription2006 Jobs2013 JobsChange% ChangeMedian Hourly EarningsManagement Analysts154,354158,4134,0593%$27.99Clinical, Counseling, and School Psychologists44,89544,662-233-1%$31.61Physicians and Surgeons, All Other38,95632,742-6,214-16%$67.58Chief Executives48,49541,754-6,741-14%$26.84Graphic Designers78,92271,673-7,249-9%$18.04Dentists, General44,81136,421-8,390-19%$80.54Personal Financial Advisors54,99445,480-9,514-17%$30.76Accountants and Auditors122,819106,737-16,082-13%$26.42Lawyers204,851183,977-20,874-10%$37.53MOST GROWTH (Total New Jobs)Description2006 Jobs2013 JobsChange% ChangeMedian Hourly EarningsManagers, All Other258,566298,40539,83915%$16.79Landscaping and Groundskeeping Workers297,490335,42937,93913%$9.90Maids and Housekeeping Cleaners400,504437,60637,1029%$8.73Construction Laborers318,733349,02030,28710%$12.74Personal Care Aides95,602112,96917,36718%$9.13Web Developers16,11126,93010,81967%$17.92Recreation Workers22,99732,1139,11640%$11.34Medical Transcriptionists2,37311,2758,902375%$12.02Home Health Aides36,36244,5138,15122%$9.14Photographers63,93571,9037,96812%$13.34MOST DECLINE (Total Job Losses)Description2006 Jobs2013 JobsChange% ChangeMedian Hourly EarningsFarmers, Ranchers, and Other Agricultural Managers561,631437,011-124,620-22%$10.24Construction Managers247,655154,470-93,185-38%$15.52Real Estate Sales Agents317,142246,010-71,132-22%$14.76Carpenters476,374408,877-67,497-14%$13.75First-Line Supervisors of Construction Trades and Extraction Workers195,456131,010-64,446-33%$15.12First-Line Supervisors of Retail Sales Workers323,825261,331-62,494-19%$11.43Childcare Workers568,552516,050-52,502-9%$6.41Heavy and Tractor-Trailer Truck Drivers237,575202,233-35,342-15%$15.91Painters, Construction and Maintenance220,815192,761-28,054-13%$13.31First-Line Supervisors of Non-Retail Sales Workers133,061105,493-27,568-21%$15.08Source: Self-Employed - EMSI 2013.4 Class of Worker
Note: The “physicians and surgeons, all other” category includes all self-employed physicians and surgeons not included in the broad physicians and surgeons occupation or in other health diagnosing and treating practitioner categories. Keep in mind that respondents to the American Community Survey self-report their occupation, thus making the data subject to error.
Composition of the Self-Employed Workforce
The most likely demographic to be self-employed: older men. As of 2013, men took up 62 percent (6.2 million) of self-employed jobs in the U.S, and more than 30 percent of the self-employed were 55 years and older. The next largest age group was 45- to 54-year-olds (28 percent of all jobs).
In some of the largest self-employed occupations, close to half of all workers are at least 55. This includes farmers and ranchers (49 percent are 55 and over); accountants and auditors (48 percent); lawyers (46 percent); and real estate agents (45 percent).
Self-employed workers also on average make less than their salaried counterparts. Median hourly wages for self-employed jobs are $15.78 per hour, compared to $20.35 per hour for salaried employees. The lowest earners are in personal care and service occupations ($8.84 per hour) and food prep and serving occupation ($9.05). The highest earners are health care practitioners ($51.00) and legal workers ($35.66).
Geographical Breakdown
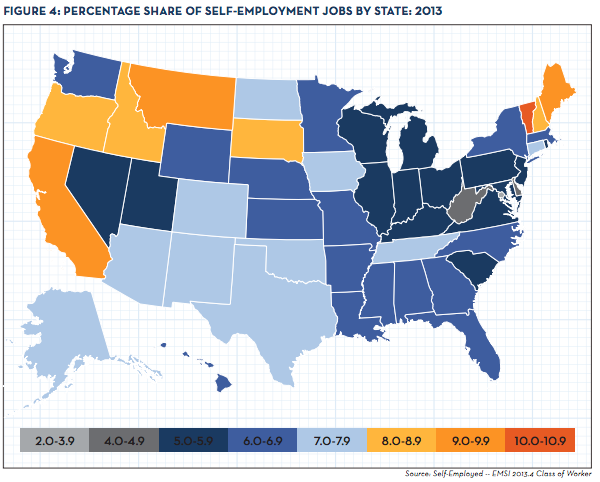
While few areas of the country have experienced an expansion of self-employed jobs since 2009, more than 30 of the 100 largest metropolitan areas have bigger shares of self-employment than the national average. McAllen, Texas, and Riverside-San Bernardino-Ontario, Calif., lead all large metros with 11.9 percent and 11.2 percent of their total jobs, respectively, made up by people who work on their own. As Table 2 shows, Buffalo-Niagara Falls, N.Y., has the smallest share among the 100 largest metros at 3.5 percent, followed by Salt Lake City (4.1 percent) and Virginia Beach-Norfolk-Newport News, Va.-N.C. (4.2 percent).
TABLE 2: SHARE OF SELF-EMPLOYED JOBS BY MSAMetropolitan Statistical Area NameShare of Self-EmployedLARGESTMcAllen-Edinburg-Mission, TX11.9%Riverside-San Bernardino-Ontario, CA11.2%Los Angeles-Long Beach-Santa Ana, CA9.9%Oxnard-Thousand Oaks-Ventura, CA9.2%Miami-Fort Lauderdale-Pompano Beach, FL9.2%Bridgeport-Stamford-Norwalk, CT9.2%San Francisco-Oakland-Fremont, CA8.7%Stockton, CA8.3%Portland-Vancouver-Hillsboro, OR-WA8.3%Sacramento--Arden-Arcade--Roseville, CA8.2%Lancaster, PA8.0%SMALLESTBuffalo-Niagara Falls, NY3.5%Salt Lake City, UT4.1%Virginia Beach-Norfolk-Newport News, VA-NC4.2%Albany-Schenectady-Troy, NY4.3%Harrisburg-Carlisle, PA4.3%Syracuse, NY4.3%Milwaukee-Waukesha-West Allis, WI4.5%Rochester, NY4.7%Grand Rapids-Wyoming, MI4.7%Baltimore-Towson, MD4.8%Madison, WI4.8%Richmond, VA4.8%Louisville/Jefferson County, KY-IN4.8%Source: Self-Employed -- EMSI 2013.4 Class of Worker
Among large metros, only five have seen at least 2 percent growth in self-employment jobs since the end of the recession in 2009: Memphis (4 percent), Bridgeport-Stamford-Norwalk (3 percent), Austin (2 percent), Orlando (2 percent), and Las Vegas (2 percent).
Even fewer states have seen self-employment increases since 2009. North Dakota’s self-employed ranks grew 5 percent and Washington, D.C.’s grew 1 percent, while every other state declined from 2009 to 2013. The growth in North Dakota has come predominantly among real estate agents (190 new jobs since 2009, up 69 percent), retail sales supervisors (239 new jobs, up 36 percent), and construction laborers (211 new jobs, up 31 percent) – all likely byproducts of the oil boom. In D.C., the fastest-growing self-employed occupations have been couriers and messengers (475 new jobs since 2009, up 417 percent), door-to-door sales workers (268 new jobs, up 218 percent), and maids and housekeeping cleaners (186 new jobs, up 34 percent).
Besides Rhode Island (-13 percent), the biggest job losses have come in the South – West Virginia (-15 percent), Arkansas and Kentucky (both -11 percent), and Mississippi (-10 percent).
Vermont, meanwhile, has the greatest share of self-employed jobs (10.2 percent of all jobs as of 2013). Montana is second at 9.7 percent, while Maine (9.5 percent), California (9.0 percent), and Oregon (8.7 percent) round out the top five. Washington, D.C., with its huge government sector, has far and away the lowest share of self-employed jobs (2.1 percent).
[1] First-line supervisors of retail sales workers, as shown under occupations with the most decline, includes proprietors of small, unincorporated businesses that may have LLC status and/or have employees under contract. For example, an owner of a small gift shop or antique store who has a single employee may be listed as self-employed in this occupation. Sole proprietors of unincorporated businesses are also likely included in the “managers, all other” occupational category, as well as other manager/supervisor occupations.
Data shown in this post comes from Analyst, EMSI’s web-based labor market data and analysis tool. For questions or data for your region, contact Josh Wright (jwright@economicmodeling.com). Follow EMSI on Twitter @DesktopEcon.


