

Note: Catherine Rampell at the New York Times’ Economix blog highlighted our findings (see here). In light of the feedback we’ve received as well as the comments under Catherine’s post — and ours — we have updated the piece.
For a while now, major media outlets — and a legion of bloggers — have reminded us that the job market for lawyers is lousy. Some law schools, in light of the dimming employment prospects for graduates, have resorted to grade inflation and other methods to, as The New York Times noted, “rescue their students from the tough economic climate — and perhaps more to the point, to protect their own reputations and rankings.”
Just how bad is the job outlook for lawyers? According to our quick analysis, every state but Wisconsin, Washington, D.C., and Nebraska produced more — in some cases, far more — bar exam passers in 2009 than the estimated yearly openings for lawyers in those states. The same glut holds true when comparing law school grads, via IPEDS from the National Center for Education Statistics, to the same opening estimates. [1. EMSI’s annual opening figures are the sum of new plus replacement jobs, the latter of which come about as a result of turnover (employees changing jobs, retirements, etc.).] And when you take into account nuances with the D.C. bar and how Wisconsin operates (see more below), there might not be any states with a shortage.
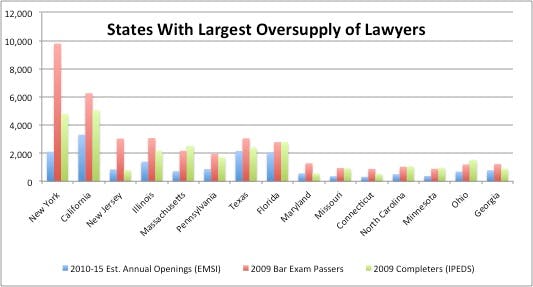
New York has far and away the largest oversupply; 9,787 law grads passed the bar exam there in 2009, more than 10% of the active attorney workforce in the state. [2. Bar exam results for 2010 are available here; EMSI used 2009 data to line up with available IPEDS data.] EMSI estimates New York will need 2,100 new lawyers annually through 2015, creating a glut of 7,687 per year if the 2009 supply figures hold firm. (The imbalance is less striking with IPEDS completers.)
As is the case in every state, not all of these new grads will practice in New York. But the data still points to a surplus.
On the national level, there were nearly twice as many bar exam passers (53,508) in ’09 than openings (26,239). It should be noted that not all those who pass the bar exam in each state are new graduates. Some law school grads wait several years to take the test. Others take it multiple times before passing (the national pass rate in ’09 was 68%), and some have to take it again if they want to practice in another state. Still, the bar exam data appears to be the best measure of lawyer supply from year to year, with the exception of D.C. and Wisconsin. (We also compiled IPEDS completers by state to see how both datasets match up.)
Here’s the data (including median wages) and supply/demand comparisons for every state that we compiled using EMSI’s Analyst. Note: Use the table’s search function to quickly find any state; national figures are at the bottom.
2010-15 Est. Annual Openings2009 Bar Exam Passers2009 Completers (IPEDS)Surplus/ShortageMedian WagesNew York2,1009,7874,7717,687$56.57California3,3076,2585,0422,951$50.61New Jersey8443,0377872,193$43.84Illinois1,3943,0732,1661,679$51.54Massachusetts7152,1652,5201,450$43.89Pennsylvania8691,9431,6971,074$46.05Texas2,1553,0522,402897$41.55Florida2,0272,7822,781755$36.39Maryland5601,277548717$41.46Missouri362943908581$39.96Connecticut316880510564$43.69North Carolina5031,0321,053529$37.79Minnesota378888948510$43.69Ohio6861,1941,513508$34.69Georgia7791,217894438$46.11Colorado547967509420$40.83Virginia9561,3751,435419$49.34Louisiana357731810374$33.35Tennessee389735446346$37.34Washington619935678316$37.37Oregon291594519303$34.51Indiana339602825263$32.48South Carolina262506410244$33.03Kentucky261478389217$34.39Nevada219392143173$40.32Arizona440607378167$37.51New Mexico134298114164$29.78Michigan8621,0241,993162$35.22Kansas190351296161$31.16Alabama295455406160$37.98Iowa155290556135$32.16Rhode Island102209184107$39.65Hawaii7617988103$33.70Mississippi17326833595$28.86Utah30840128393$37.04W. Virginia10019115291$32.51Montana811638382$24.96Maine751539178$29.70Arkansas15222724375$30.83Wyoming401138073$29.86New Hampshire9215414662$30.84Oklahoma32638748961$29.56South Dakota38837345$29.19North Dakota33638030$28.78Idaho1281579729$30.77Alaska4166025$37.80Delaware11614123525$60.67Vermont51551914$30.48Nebraska112109279-3$32.47Wisconsin262248691-14$36.43D.C.6182732,109-345$70.96Nation26,23953,50844,37627,269$44.22
Please note the above chart and table were corrected to include the right number of IPEDS completers for North Carolina (1,053).
The wage data for lawyers is also interesting, if only for the wide variances by state. The District of Columbia has by far highest hourly median wages ($70.96) for lawyers in the nation while Montana has easily the lowest ($24.96), followed by North Dakota ($28.78) and Mississippi ($28.86).
Eight states have median wages below $30 per hour. As the the Above the Law blog points out, “That’s the kind of pay that a lot of people can get without three years of post-graduate education and six figures of debt.”
UPDATE: Several readers have noted the special cases in Washington, D.C. and Wisconsin that should be kept in mind when looking at the above surplus/deficit numbers.
Lawyers in good standing and licensed in other states can practice in D.C. — or be “waived into” membership — which explains why there are very few who actually take the bar exam there. In Wisconsin (and perhaps Wyoming and Nebraska, as one commenter noted) graduates from law schools in the state do not have to pass the bar before practicing. This is one reason why looking at the completers data from NCES is helpful; not all law schools grads at Wisconsin will practice in the state, but there’s a good chance the completer number for Wisconsin (691) is a more accurate measure of the supply than the bar exam passer number (248). The same is true for D.C.
Even with these caveats, the data still suggests a national glut of new lawyers. The two states (plus D.C.) that originally looked to not be oversupplying the market — Wisconsin and Nebraska — are most likely producing too many after all.


