
Fun fact: Industries address their talent needs in different ways. And a lot of that can be determined by their job posting strategies.
For example, when the US trucking industry faced a major shortage of long-haul truck drivers back in 2005, they offered big pay raises and hiring bonuses. But it wasn’t enough. In fact, according to the American Trucking Association, the shortage grew to a staggering 60,000 drivers by the end of 2018.
So what did the trucking industry do next? Desperate to fill jobs, they implemented an aggressive job posting strategy. They blasted job boards, posting as many jobs in as many places as possible.
The trucking industry’s challenges aren’t necessarily unique. With today’s tight labor market, every industry is facing a talent squeeze. But what’s fascinating is how they all respond via their online job posting strategies.
Job postings vs job openings
So, we decided to take an in-depth look at the different job posting strategies of industries to get a better sense for how they search for talent. Further, we’ll add context by also showing you how many people they actually hire vs how much they actually post.
To do this, we used our own job posting data, which is scraped from job boards, websites, and many other outlets companies use to post jobs. We also used data from the Bureau of Labor Statistics’ Job Openings and Layoff Turnover Survey, usually referred to as JOLTS. JOLTS estimates the number of jobs that are open for hire within each industry. By comparing job openings with Lightcast’s job posting data, we can reveal the job posting strategies for each industry.
Note: In the chart below, Business Services includes NAICS 54 (Professional, Scientific, and Technical Services), 55 (Management of Companies and Enterprises), and 56 (Administrative and Support and Waste Management and Remediation Services). This is because JOLTS uses an older version of NAICS, which is now 54, 55, and 56. To keep the comparison consistent between Lightcast job posting data and JOLTS openings data, we included all three NAICS in this category.
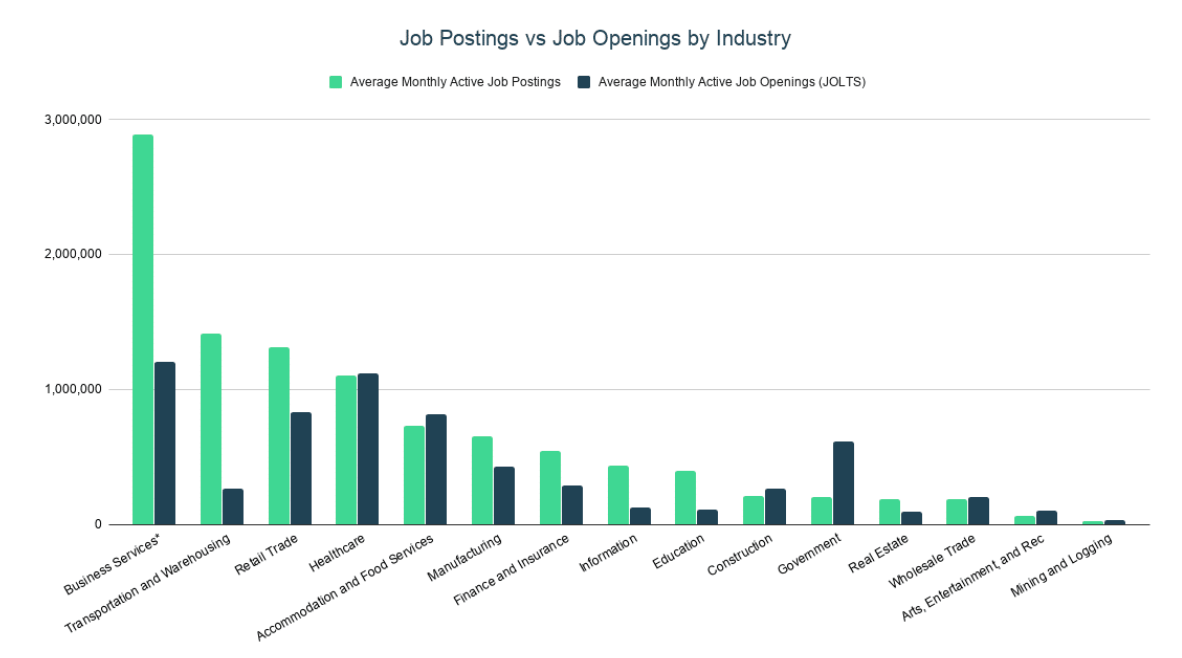
Source: BLS JOLTS Job Openings and Lightcast Job Posting Analytics, 2019. Showing average monthly postings and openings from Sept. 2016-Nov. 2019.
*Business Services includes NAICS 54, 55, and 56.
As you can see, there is a notable variety between industries. For example, Business Services (which includes NAICS 54, 55, and 56) dominates job postings. This is likely because these professional jobs like management, legal services, technical jobs, office administrative services, accounting services, advertising and public relations, etc., tend to be more represented in the job posting ecosystem. Plus, employers often post across multiple cities for these roles.
From this postings vs openings data, we found that industries typically fall into one of three categories:
1. Industries that post more than they hire
In the graph below, the green line shows the number of job postings for the transportation and warehousing industry (the majority of which is populated by trucking occupations) between January 2017 and July 2019. At its peak, the industry had over 1.8 million postings in September 2017. However, as shown by the dark blue line, there were no more than 360,000 openings per month. So why would the number of postings be so high?
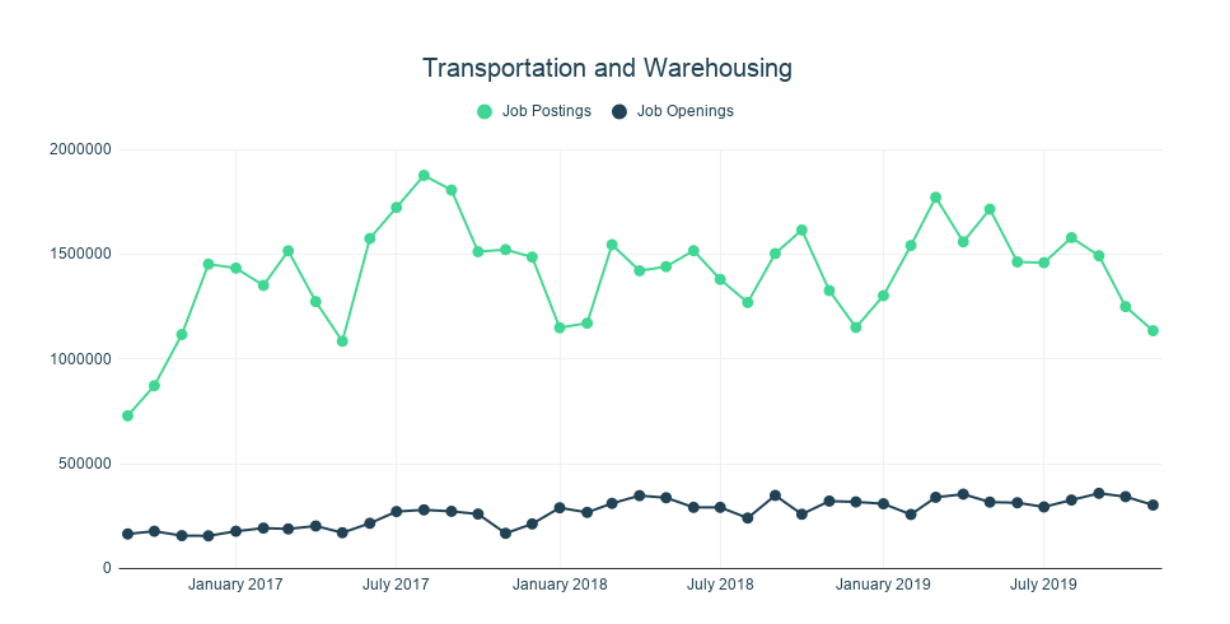
Source: BLS JOLTS Job Openings and Lightcast Job Posting Analytics, 2019. Showing data for Sept. 2016-Nov. 2019.
Well, this is where labor market trends come into focus. As we mentioned earlier, the transportation and warehousing industry posts aggressively to various job boards as a way of attracting more applicants. More postings equals more applicants for a notoriously challenging job (or at least that’s the idea). Plus, cross-posting in multiple cities works for trucking because the hire doesn’t need to be tied to a specific region.
We see a similar trend in manufacturing, although less extreme. The decline of domestic manufacturing is well-known. But over the past 10 years or so, these jobs have been growing at a decent rate. The jobs that are coming back are more highly skilled and the data seems to indicate that the recent increase in manufacturing jobs, along with the increase in required skills, is likely making it difficult to find enough qualified workers.
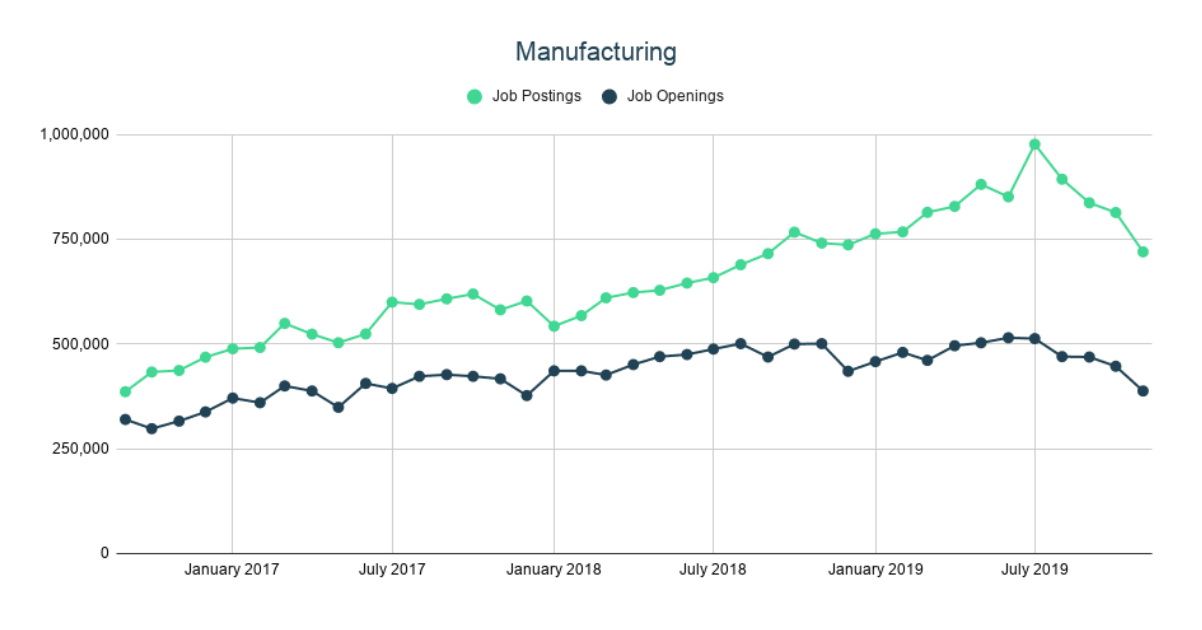
Source: BLS JOLTS Job Openings and Lightcast Job Posting Analytics, 2019. Showing data for Sept. 2016-Nov. 2019.
2. Industries that post as much as they hire
It’s important to note that not every industry uses job postings in the same way. Healthcare, for example, tends to hire and post at similar rates. This could be because these jobs are typically educated/professional careers like registered nurses, surgeons, dentists, psychiatrists, etc. So it’s unlikely that employers would blast job boards to fill one highly-skilled pediatrician job.
In January of 2019, JOLTS recorded 1.16 million openings for occupations such as registered nurses and general practitioners (shown in dark blue), and Lightcast JPA data found 1.12 million postings for similar positions (green).
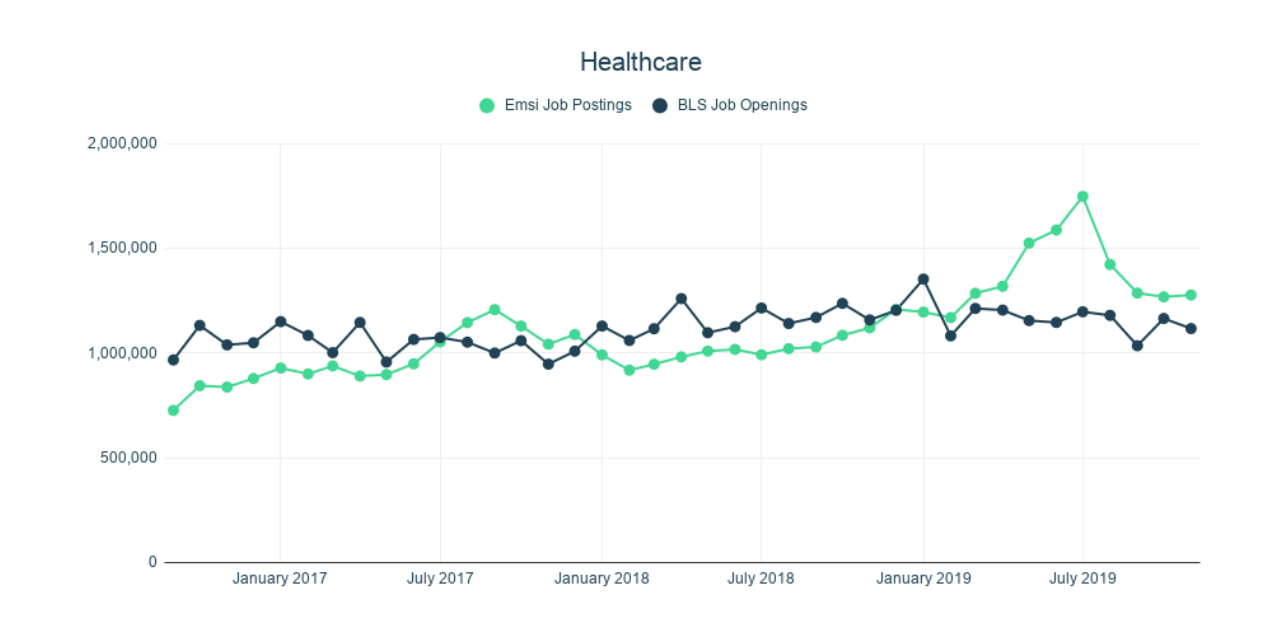
Source: BLS JOLTS Job Openings and Lightcast Job Posting Analytics, 2019. Showing data for Sept. 2016-Nov. 2019.
Fun fact: nurses are over-posted by about five times, while physicians are slightly under-posted.
3. Industries that post less than they hire
Some industries, such as accommodation and food service, tend to hire more than they post. For example, restaurants generally hire locally, using word-of-mouth or “help wanted” signs. They don’t need complex posting strategies to fill lower-skilled roles like waiters and waitresses, housekeeping cleaners, and cooks (most of which are seasonal hires with higher turnover).
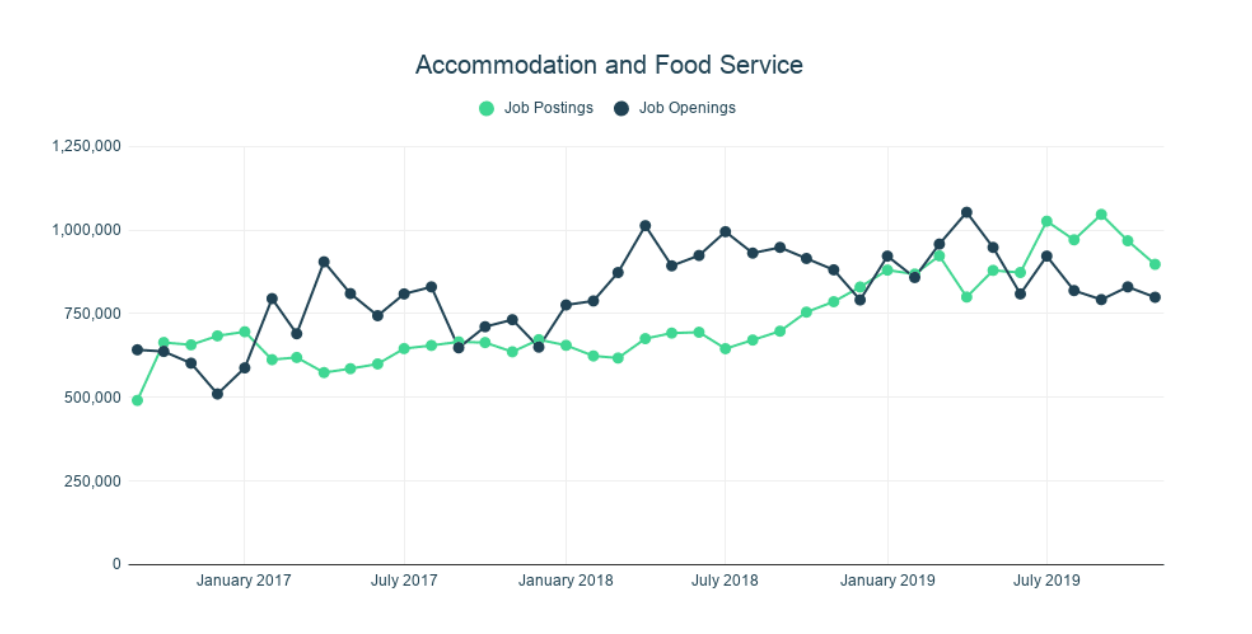
Source: BLS JOLTS Job Openings and Lightcast Job Posting Analytics, 2019. Showing data for Sept. 2016-Nov. 2019.
Around May of 2018, there were just over 1 million openings for the accommodation and food service industry, but less than 700,000 postings for those positions. The shifts visible near July of each year reflect the high turnover rates in the summer and slower business in the winter months.
The jump in posting activity in summer 2019 could also be an indicator of the tight labor market. If restaurants struggled to recruit workers, they likely took to the job boards to find critical talent.
Similarly, the arts, entertainment, and recreation industry also typically posts less than it hires. Again, this is likely because the talent pool is generally local, and hires are often based on referrals or word-of-mouth. After all, George Clooney probably isn’t scouring Hollywood job boards for his next Oscar-winning role.
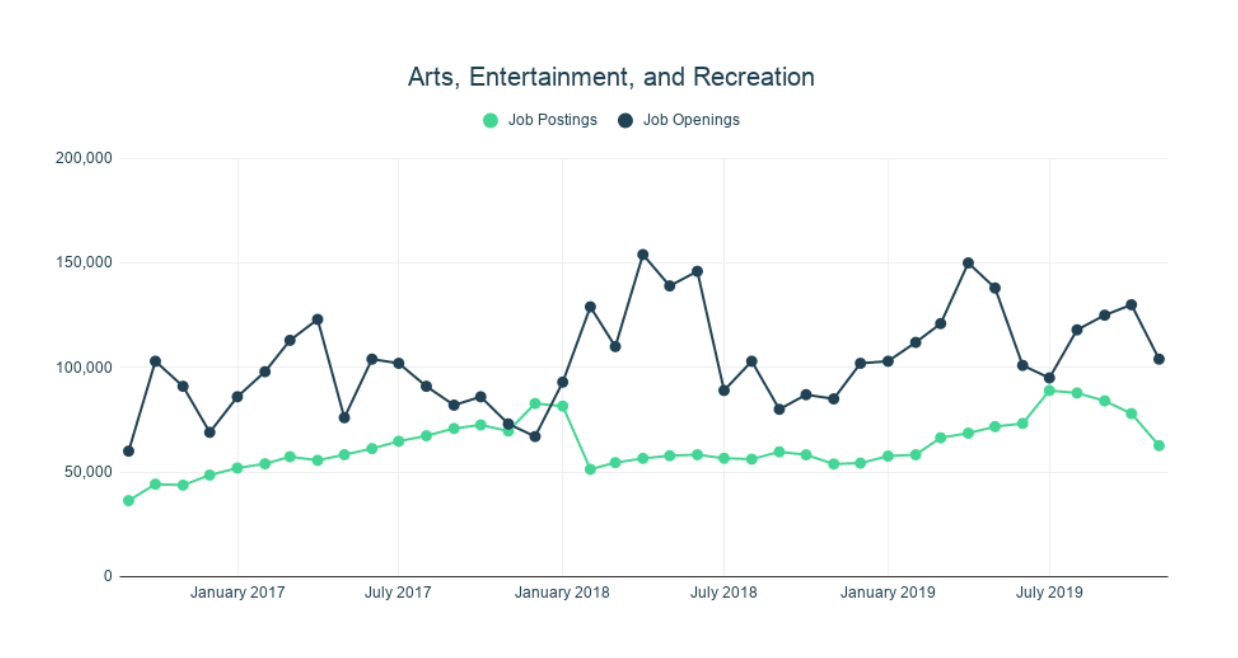
Source: BLS JOLTS Job Openings and Lightcast Job Posting Analytics, 2019. Showing data for Sept. 2016-Nov. 2019.
Job posting strategies are essential
Every industry’s talent needs are different. And their job posting strategies provide valuable insight into how they respond to their respective challenges. This can also be beneficial on a company level, allowing businesses to monitor the job posting strategies of their competition.
In the scatter plot below, we can see how some of those strategies play out. Oracle, which consistently deploys an aggressive, multi-city posting strategy, tops the chart with nearly 92,000 average monthly postings in 2019. That’s a huge number, but it’s even more stark when compared to Oracle’s company size of 137,000. On the other end, we see Walmart, a company 16 times the size of Oracle, posted an average of nearly 40,000 jobs per month in 2019.
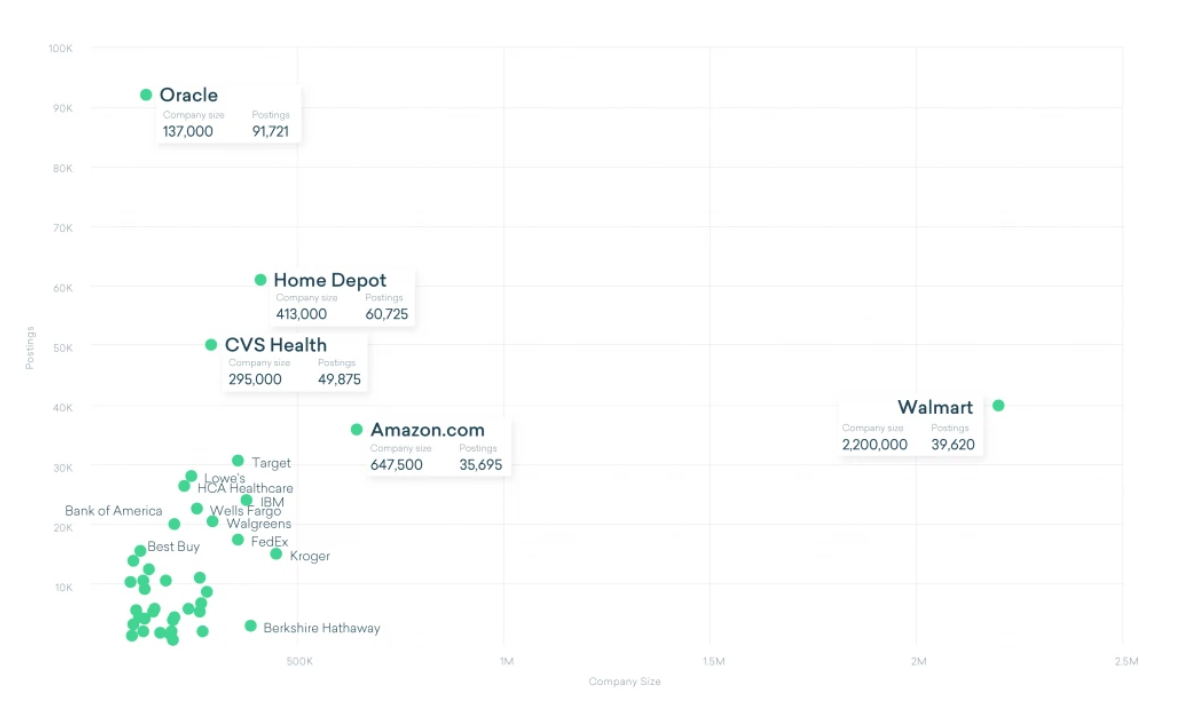
Source: BLS JOLTS Job Openings and Lightcast Job Posting Analytics, 2019. Showing average monthly postings in relation to company size from Jan. 2019-Dec. 2019.
Job posting data is also beneficial for those working in higher education. For example, it can help show both the magnitude (number of openings) and intensity (posting frequency) of employer demand for a school’s graduates. Schools can use this information to decide what programs to offer (and at what scale), ensuring their students graduate into good career opportunities and not an oversaturated labor market.
By combining real-time data like job postings with traditional labor data like JOLTS, we can get an accurate, up-to-date read on the health of any US industry at any time.


