
After a few weeks of travel and other obligations that kept me away from the Letter from the Chief Economist, we’re back today with plenty to discuss. Let’s jump right in.
Putting Remote Work On The Map
We’re now three years out from when COVID-19 first hit. Its impact on the labor market continues to be felt in countless ways, but I would argue its most notable impact was on remote and flexible work. As time went on and people stayed out of the office, it became clear that we needed a framework for understanding just how much demand for working from home has increased—all over the world.
Now we have one. The WFH (Work from Home) Map, a new tool based on Lightcast job posting data, is live now, with interactive charts and downloadable data on the rise of remote work.
The figures used on the site are based on the data used in the working paper “Remote Work Across Jobs, Companies, and Space” by myself, Stephen Hansen, Peter John Lambert, Nicholas Bloom, Steven J. Davis, and Raffaella Sadun.
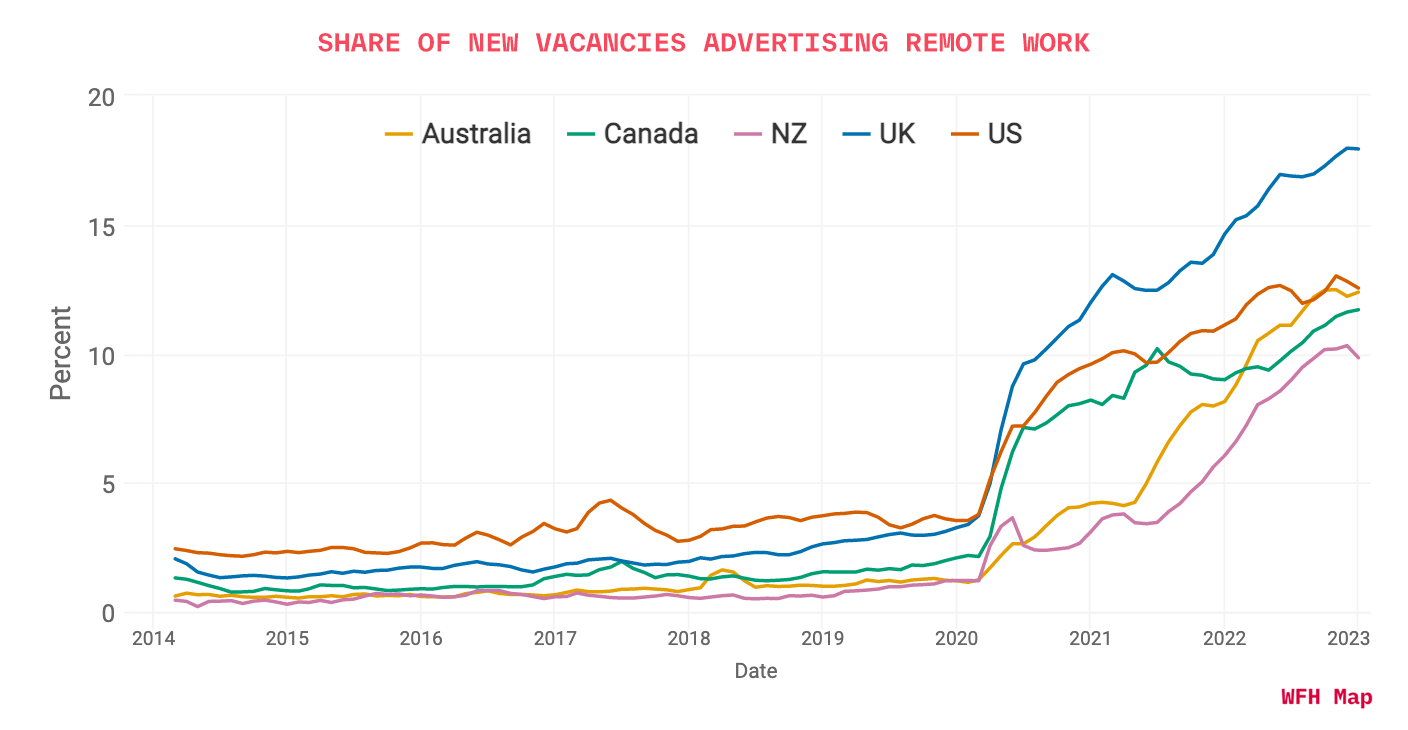
If a posting advertised one or more days of remote work per week, we counted it as a WFH vacancy (as found using our text algorithm that analyzes offerings based on the raw text of postings themselves). So our analysis covered both hybrid and fully-remote roles. As we can see, no country ever saw remote work postings reach 5% of total postings before 2020, but in the years since, the number of those vacancies grew tremendously, with remote work in every country under consideration reaching over 10% of all vacancies.
One thing I especially want to note is that while the US had the highest percentage of remote vacancies before the pandemic, the other countries saw those rates increase much more. Moving forward, I think it’s very important to understand that WFH is a global phenomenon and not limited to just one region, and any understanding of remote work should consider its international reach.
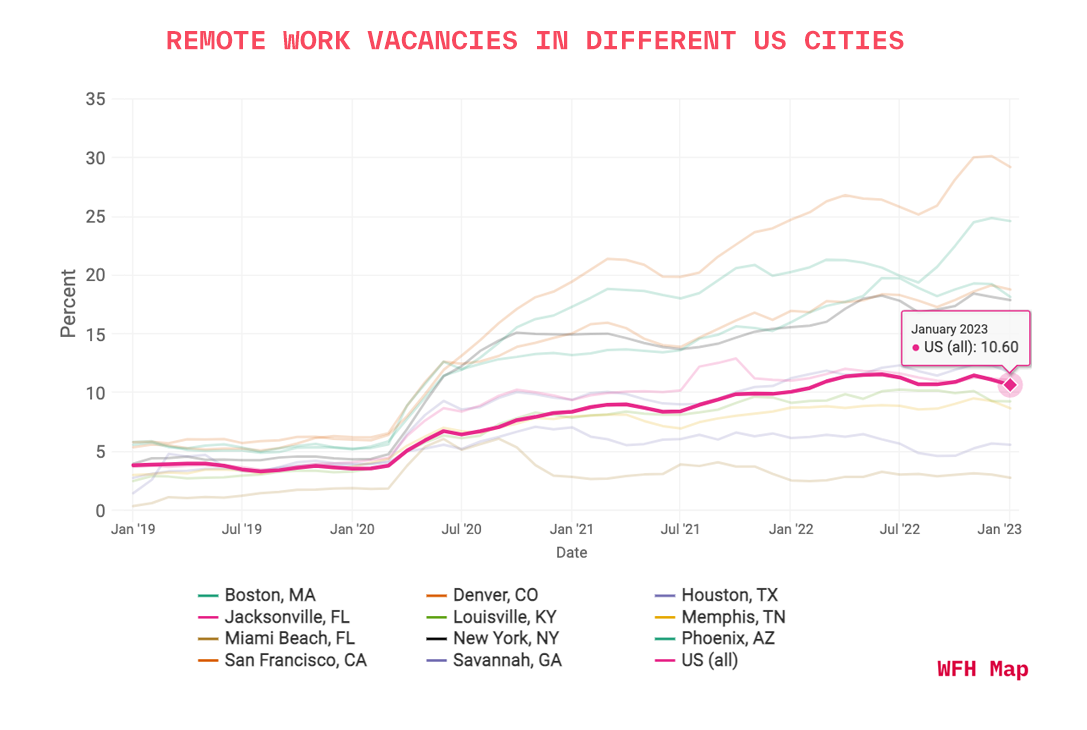
There’s much more to explore on the site, including a breakdown of which occupations are seeing higher rates of remote work, as well as a breakdown of how prevalent WFH is across different US cities (San Francisco has the highest rates, but Boston placed second—and here it might be worth noting I’m writing this from home and not the Lightcast Boston office today).
I’m very proud of the work this team has done and excited to see what others can do with that same data. Again, the WFH Map website is here and the paper is here—or you can also read this “Economic Finding” from the Becker Friedman Institute that gives a good summary.
Economic News
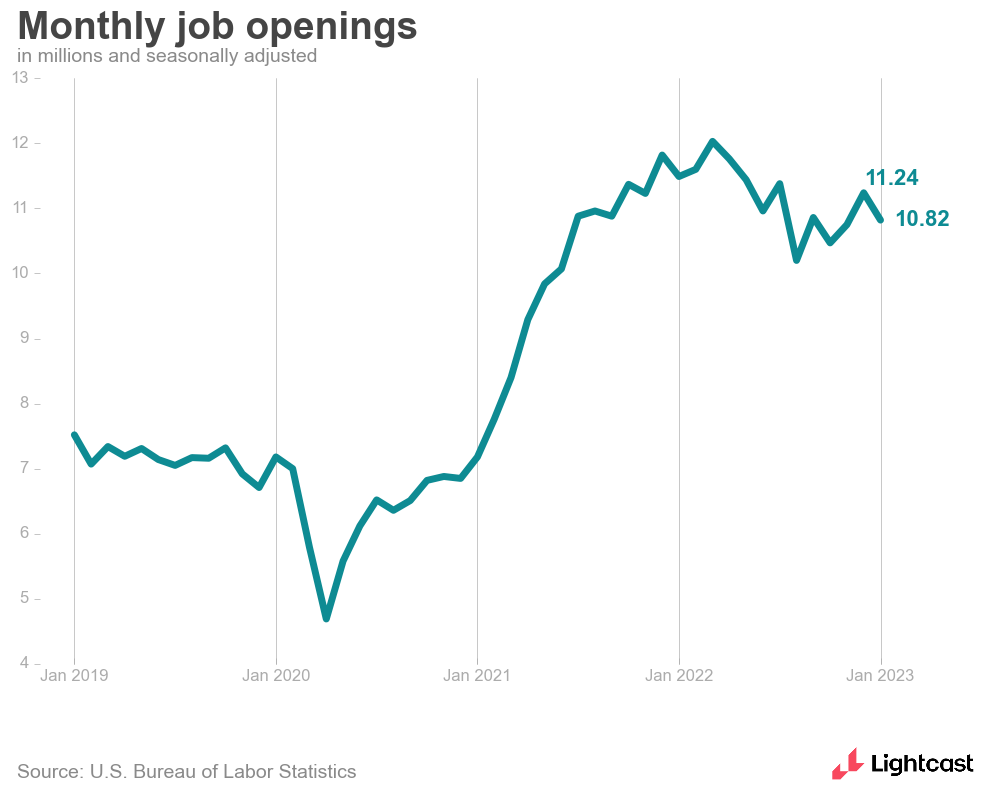
Yesterday’s JOLTS showed the labor market is still hot, but it might show some early indications of cooling off. While we’ve come to expect the unexpected in these reports, nothing was too terribly shocking in the January numbers: openings decreased to 10.8 million, down from a revised 11.2 million in December, which was above expectations but not dramatically so. My colleague Layla O’Kane and I discussed the report right after it came out, and you can catch up on that conversation here.
So far in 2023, many eyes have been on the tech sector and the layoffs happening there, but that’s harder to parse in this data than one might expect: many tech firms are classified as being part of the Information industry, but many others are part of Professional and Business Services. Layoffs rose sharply in Professional and Business Services (up 190,000), and quits decreased dramatically as well (going down 221,000). However, job openings in the industry also rose by 95,000, while openings were also up 35,000 in Information.
As I’ve said before, the companies going through layoffs aren’t the entire tech sector, and the tech sector isn’t the entire economy. So while layoffs were up overall in January, we’re nowhere near a situation where they’re a widespread concern across the labor market.
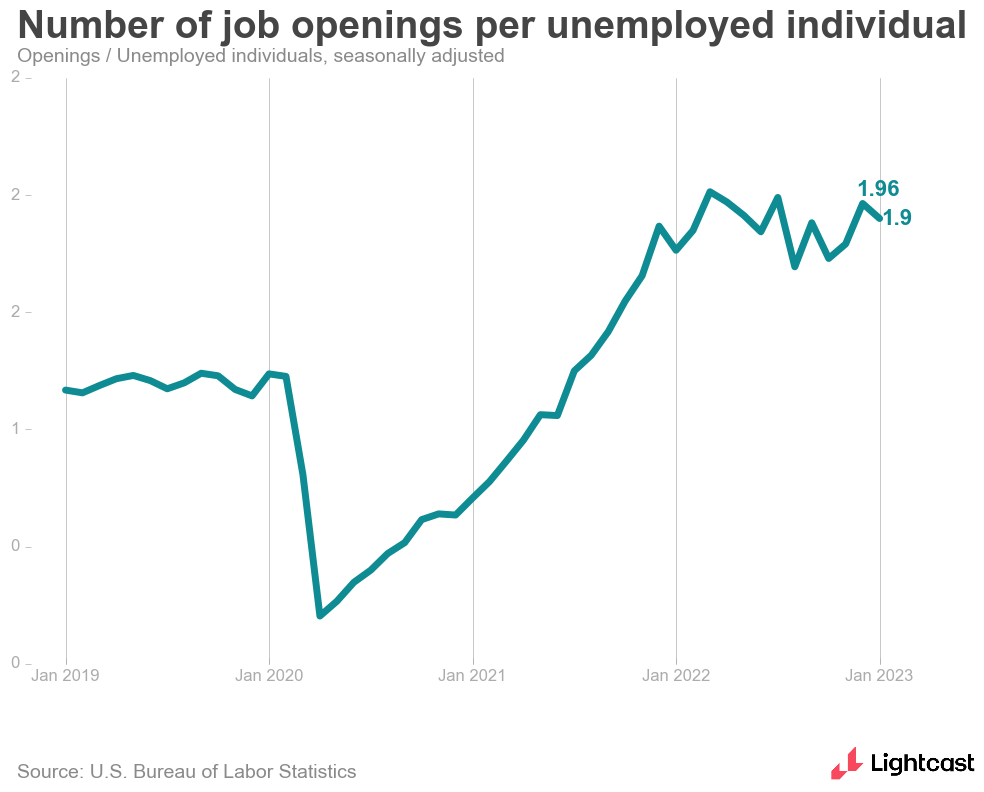
Lower down in the industry data, I also thought it was interesting that openings fell quite a bit for Construction (-240,000) and Accomodation and Food Services (-204,000). Both sectors had been hard hit by the overall lack of workers, so there’s a chance they’re finding more workers and filling those jobs, which would be a welcome sign of softening. However, if the drop indicates slowdowns for those industries, that would be cause for more concern. At this point, it’s too soon to tell: for now, there are still 1.9 job openings per unemployed person, and the market is still very tight, like it has been for months.
Of course, the ongoing tightness is of interest to many of us, but perhaps nobody more than Federal Reserve Chair Jay Powell, who was on Capitol Hill this week addressing both houses of Congress. Presumably, the lawmakers wanted to hear what the Fed’s plans were moving forward as it tries to limit inflation without causing the economy to crash. But Powell seemed insistent on not saying what kind of interest rate hikes were coming—which I thought was telling in its own way.
“I stress that no decision has been made on this,” he said. “If the totality of the data were to indicate that faster tightening is warranted, we would be prepared to increase the pace of rate hikes." In other words, he’s emphasizing that the Fed’s decisions will be driven by data, not according to a pre-set path.
One of the biggest data points contributing to those decisions will be tomorrow’s Employment Situation report. A strong number would suggest that the Fed would be prepared to increase rates more, while fewer jobs would likely lead to a smaller increase. At the next meeting to set that policy, it will almost certainly be a debate between a 0.25% and 0.5% hike.
We’ll know more Friday—and my colleagues Elizabeth Crofoot and Ron Hetrick will be live with their analysis soon after the jobs report comes in on the Lightcast LinkedIn, YouTube, and Twitter pages. I’ll be tuning in and hope you will too.
Until next week,