
You don’t need me to tell you that the holidays are in full swing, with snow starting to fall and Christmas music playing all over. Speaking personally, I have lots of gifts left to buy, but others who stay more organized have been doing plenty of holiday shopping.
The busy season for retail inspired us to pull some job posting data on how things have changed in terms of people buying things this year, as compared to the recent past. Here’s what we found:
Demand for e-commerce jobs has increased much more than brick and mortar retail jobs since 2019. That’s no surprise, but the scope might be: during the height of the pandemic, e-commerce demand was up 793%, while brick and mortar demand was down 33%.
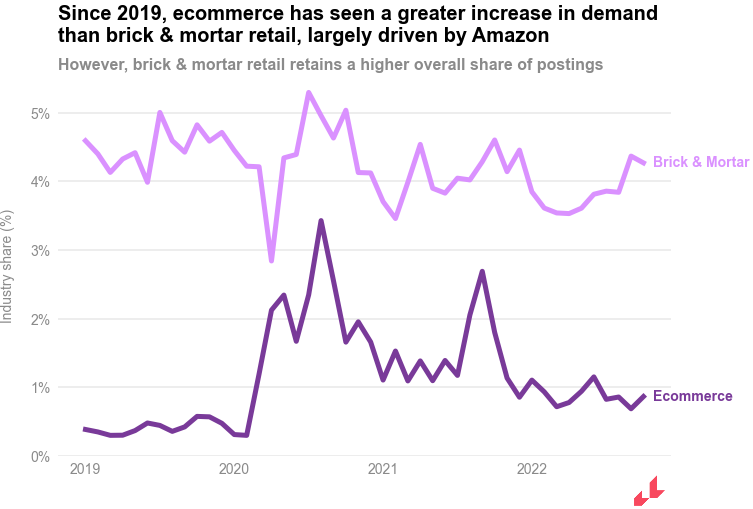
Overall, e-commerce demand has increased 125% from pre-pandemic levels. After its initial 33% dip, brick and mortar recovered quickly in the middle of 2020 and has stayed relatively consistent since.
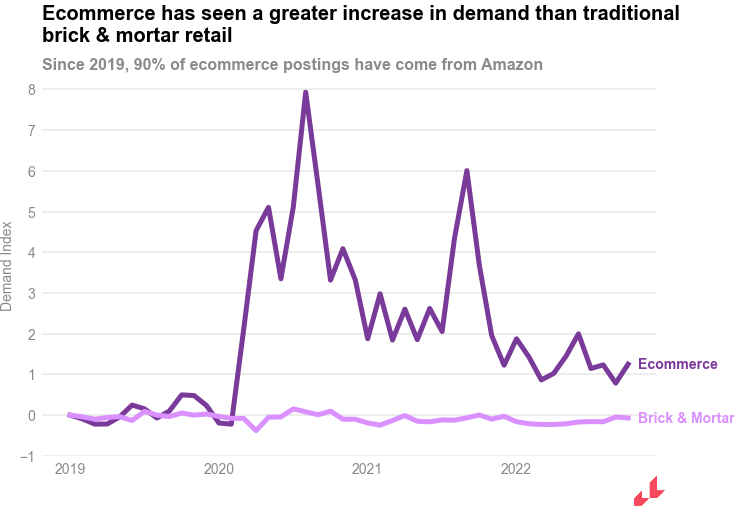
Amazon is the largest driver of e-commerce growth. Since 2019, 90% of e-commerce postings have come from them, and Amazon employs 13% of all warehouse workers in the US. Other big players in the space include UPS, FedEx, and The Home Depot.
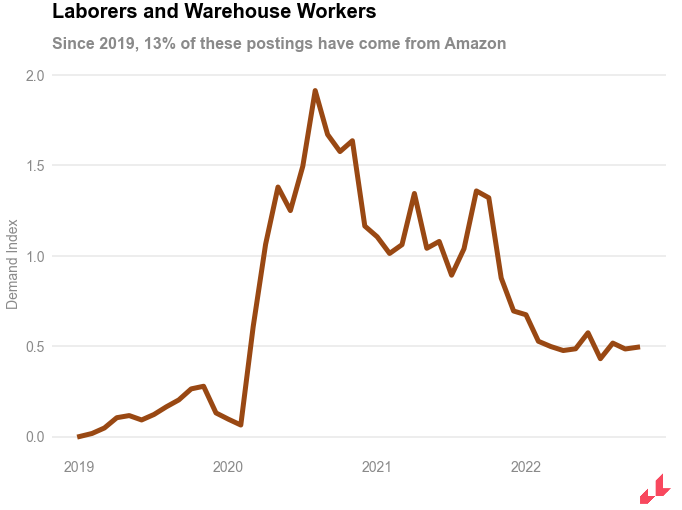
There’s a strong correlation between demand for e-commerce and warehousing jobs, and warehouse worker demand has increased 49% from pre-pandemic levels. The peak of the pandemic saw a 191% increase in demand.
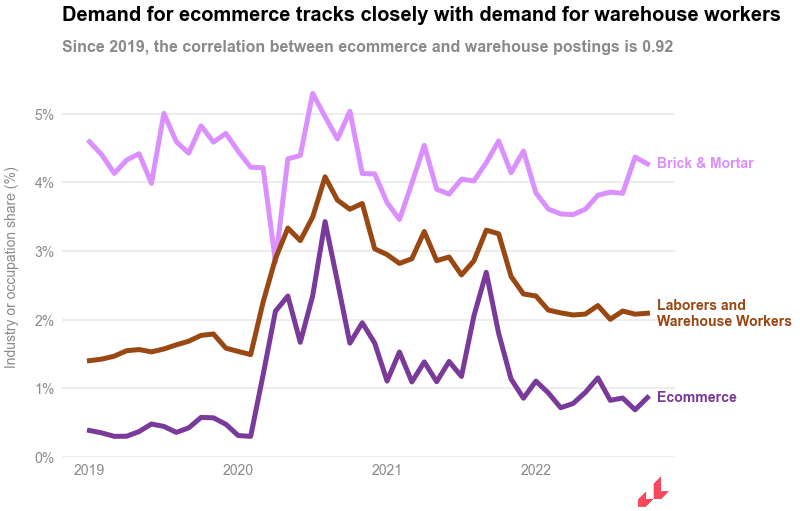
These series tell a pretty clear story: e-commerce continues to grow even as brick and mortar retail stays consistent, and Amazon is as dominant as it’s ever been. And as holiday shopping pushes forward to its finish line at the end of the year, they’ll be sure to keep busy.
Economic News
We have two international research projects out this week. The first is from City & Guilds in the UK: “Youth Misspent: Uncovering the harsh realities for Britain’s young people in today’s job market.” It’s a survey our UK office contributed to, and includes input from 5,000 British people aged 18–24. Here are three key takeaways:
13% are currently unemployed and another 3% are economically inactive – meaning that nearly 1 in 5 of those surveyed are without employment.
Of those currently studying or out of work, nearly one in ten say they never intend to start working.
30% stated they don’t think they will ever be able to achieve their career ambitions.
Taken together, it’s a challenging picture—as the title of the report suggests, it’s a harsh reality for young people in the UK. But there’s reason to be optimistic: the report also lays out recommendations for employers, educators, and the government to work together and continue to improve prospects for youth in the UK using Lightcast skills data.
The second project is Lightcast’s own: a new dashboard showing the impact of “The Great Reshuffle” in the Australian labor market. Overall, demand has grown sharply: postings are up from 171,000 per quarter in 2019 to 450,000 in the third quarter of 2022.
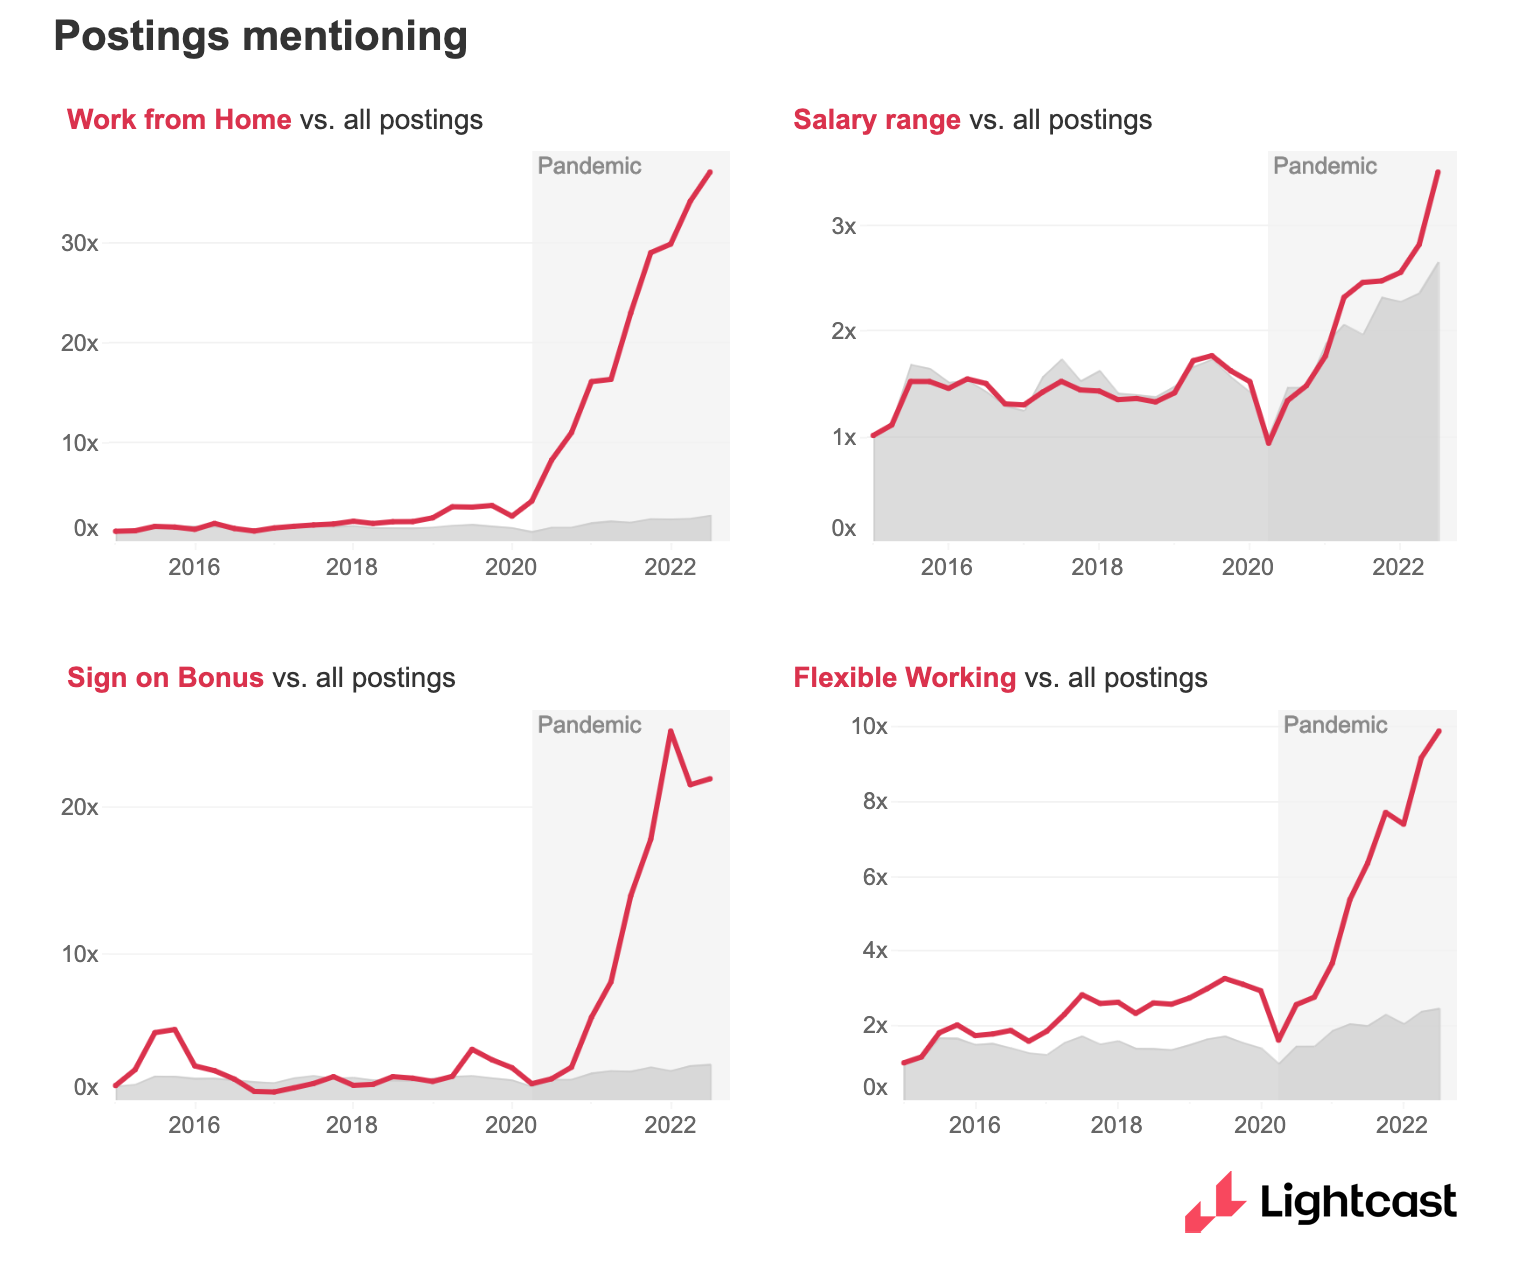
There’s a rich set of data available to dive much deeper, as well, including how trends like working from home have risen in demand over these few disruptive years.
At an industry level, those most affected have been construction, nursing, hospitality and travel, and sales. For each of those, we’re able to show granular trends like median annual salary, job security, changing barriers to entry, and how required skills have changed—you can dive into the tool to see more.
The biggest trend we’re seeing in Australia is that it’s going through the same challenges as the rest of the world: workers are scarce, and employers are trying out new strategies to attract and retain them. That means Australian employers are offering the same benefits and flexibility other countries have seen, and for the most part, they’re still on the rise.
In The Papers
I want to look at two papers this week, and they’re closely related in the way they address workplace equality— “The Rise of Conscious Consumers: The Cash Flow Implications of Corporate Workplace Equality,” by Ling Cen, Yanru Han, Chang Liu, and Jing Wu, and “Do Investors Value Corporate Workplace Equality?” also by Han. They essentially look at the same issue from two angles: how much do customers and investors, respectively, support and value businesses that prioritize equality?
Both papers use Lightcast data to create a score of workplace equality—specifically, they used textual analysis of the Equal Employment Opportunity statements that appear on job postings. The score they created is highly effective: in fact, they found it can predict future lawsuits and news related to employment discrimination, even more than the industry-standard MSCDI Diversity Score.
The first paper shows that US households spend more on products produced by firms with a high equality score, and that pattern is even stronger among minority groups. The second shows a similar pattern: investors tilt their holdings toward firms with better equality profiles—especially at times when public attention to social equality is high, such as the 2020 Black Lives Matter protests.
Like the trends on e-commerce vs. brick and mortar retail, this equality research seems natural based on how the business world has felt over the past few years. If we had to guess whether or not e-commerce was growing or if consumers are prioritizing corporate social responsibility, I think many of us would do so correctly.
But that’s the thing: we don’t have to guess. By collecting and analyzing the data, we can be sure, and that’s another small thing to celebrate.
Until next week,
Bledi Taska
Lightcast Chief Economist


