DOWNLOAD SCORECARD
Workforce issues are the highest recurring pain point for businesses in a period of sub-4% unemployment. When it comes to talent, everyone is pulling from the same pool, and competition is increasing.
In the third annual Talent Attraction Scorecard, we explore how well small and large counties are attracting and developing skilled workers. Counties are ranked using Emsi’s Talent Attraction Index, which is based on drawing new residents, growing jobs and skilled workers, attracting young talent, and increasing educational attainment.
Talent Attraction Rankings
Explore which communities are leading the pack, and see which rankings have improved or declined over the last three years. How does your county stack up?
<a href='https://economicmodeling.com/'><img alt=' ' src='https://public.tableau.com/static/images/Ta/TalentAttractionScorecard_1/2018TalentAttractionScorecard/1_rss.png' style='border: none' /></a>
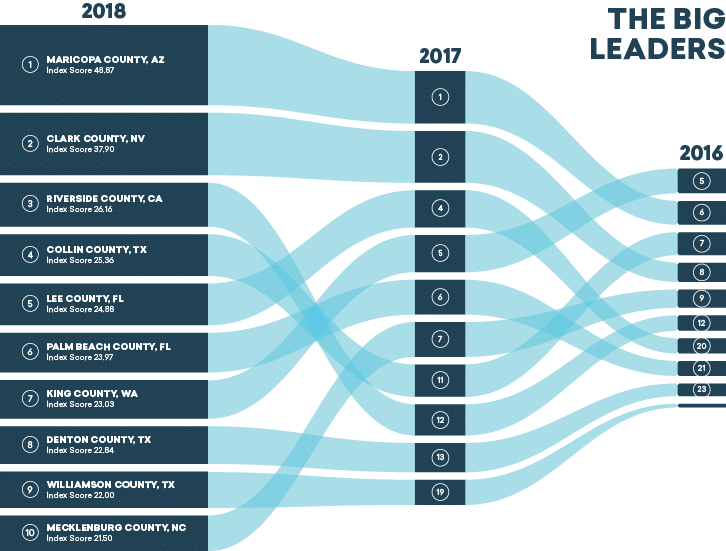
The Big Leaders
The top 10 large counties (with a population of 100,000+) are mostly in southern and western states.
Four of the top 10 counties have been in the top 10 for all three years:
Maricopa County, AZ (Phoenix)
Clark County, NV (Las Vegas)
King County, WA (Seattle)
Mecklenburg County, NC (Charlotte)
Lee County, FL and Williamson County, TX made the biggest three-year jumps.

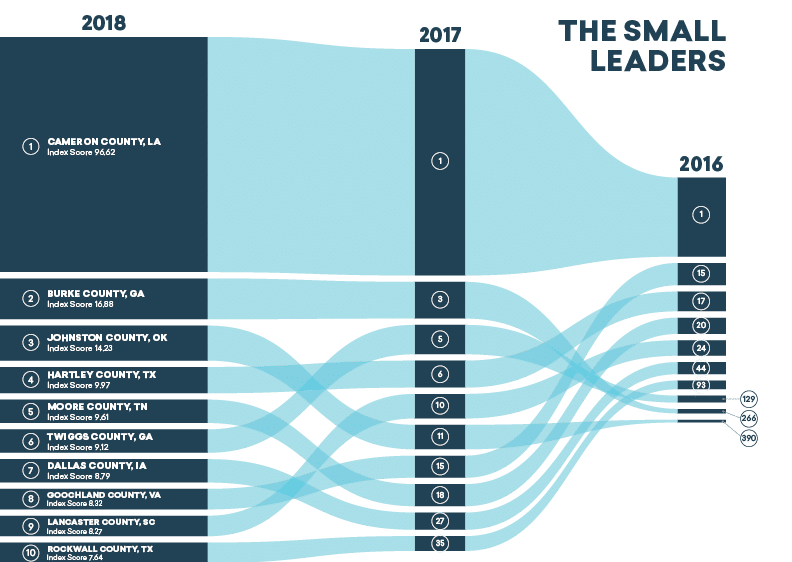
The Small Leaders
The top 10 small counties (with a population between 5,000-99,000) have a Southern and Southwest flavor, except for Iowa.
No. 1 for three years strong, Cameron County dominates with a score far exceeding the rest of the top 10 list.
Five of the top 10 counties have been in the top 10 for two years:
Cameron County, LA
Burke County, GA
Hartley County, TX
Twiggs County, GA
Lancaster County, SC
Burke, Twiggs, and Johnston counties saw big three-year jumps.
Top Two for Two Years
For two years running, Maricopa (Phoenix) and Clark (Las Vegas) counties rank as No. 1 and No. 2.
Both counties attracted more net residents in 2015-16, which has been steadily high since 2012. Both counties also rank in the top 10 for regional competitiveness, which shows they have a larger-than-expected share of skilled workers. In addition to these two dynamic counties, King (Seattle) and Mecklenburg (Charlotte) counties have appeared in the top 10 for three years in a row.

Cameron County, Three Years Strong
Cameron County, LA, topped the small county rank for the third year in a row. This isn’t surprising since it outranks all other counties with huge job growth (411%) and skilled job growth (529%) and a rise in educated talent and regional competitiveness.
From 2013-17, Cameron County saw an increase in construction and extraction occupations by 1,992%, giving it a concentration (location quotient, or LQ) of 12 times the national average.
In second and third place are Burke County, GA, and Johnston County, OK. As two of the smallest counties, both have seen significant job growth and skilled job growth.

The Talent Attraction Scorecard and a Six-Phase Talent Pipeline
Texas, Florida, and Georgia are leading the large and small rankings for different reasons. And where are all the millennials going? This, and much more, is explained in the 2018 Talent Attraction Scorecard. Download it here.
In addition to the county rankings, the Scorecard also expands on a six-phase talent pipeline for short- and long-term workforce strategies that communities can use to attract and develop talent. The framework helps navigate the complex workforce development process that requires connecting economic development leaders, K-12 and higher education, the local business community, and, of course, workforce boards.
We included this framework in our 2017 Talent Attraction Scorecard and have since expanded on it with strategies, tactics, and real-world examples.
Here is an outline of the six phases:
Talent Attraction: 0-6 month strategies
Transferable Skills: 6 month-2 year strategies
Technical and Certification Programs: 2-4 year strategies
Advanced Skill Sets: 4-7 year strategies
Information Gap: 7-10 year strategies
Starting Early: 10-15 year strategies
Fill out the form below to utilize this data and look at current year scorecards to find talent. Download the 2018 Talent Attraction Scorecard.


