
“Every job is a data job these days. The digital transformation is real and it’s here.”
– Myra Gonzalez, Director of MS in Analytics at Texas A&M University.
In a recent webinar hosted by best-selling author and higher ed journalist Jeff Selingo, Myra Gonzalez of Texas A&M University and Cat Truxillo from SAS talked about the rising demand for data literacy in today’s job market. They observed how the increasing ubiquity of data and technology across industries and job roles has led to a commensurate growth in the need for relevant skills—and for higher education to teach them.
At one point, Selingo asked Truxillo what specific courses she was seeing an increased demand for in her role as Director of Advanced Analytics Education at SAS. Anecdotally, Truxillo shared that she was seeing “a tremendous increase in data visualization demand of any flavor.”
Our interest was piqued. To better understand this demand at the national level, we jumped into Analyst and pulled up US job postings from the past 12 months that mention the skill data visualization. Here’s what we found.
The findings
Here’s how the unique job postings look over time (the chart shows data since 2016, and our 12-month timeframe is shaded in yellow). While there’s been some volatility, we can see a clearly upward trend line with a steeper slope in recent months. This matches Truxillo’s observation about a “tremendous increase” in demand.
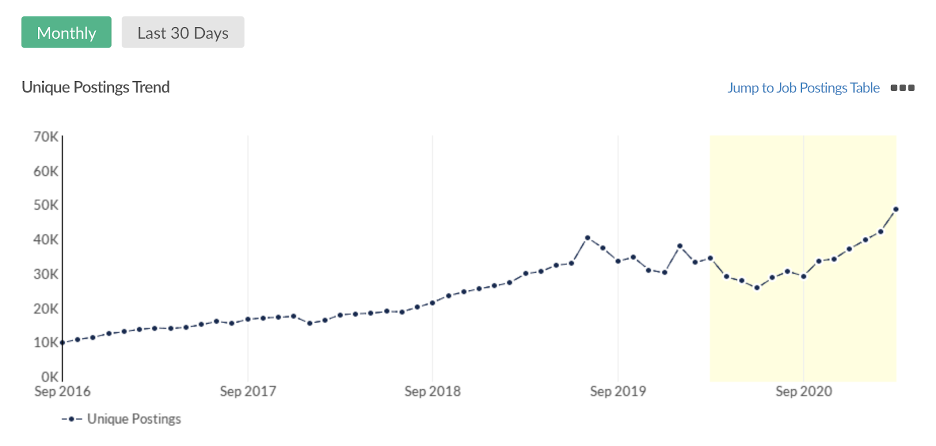
Source: Emsi Job Posting Analytics
Top companies
The top companies hiring for this skill illustrate its broad relevance and versatility. We see technology (Oracle, Amazon, Facebook), consulting (PwC, Deloitte), health insurance (Humana, Anthem), property insurance (Travelers), and engineering (Applied Materials) firms all represented:
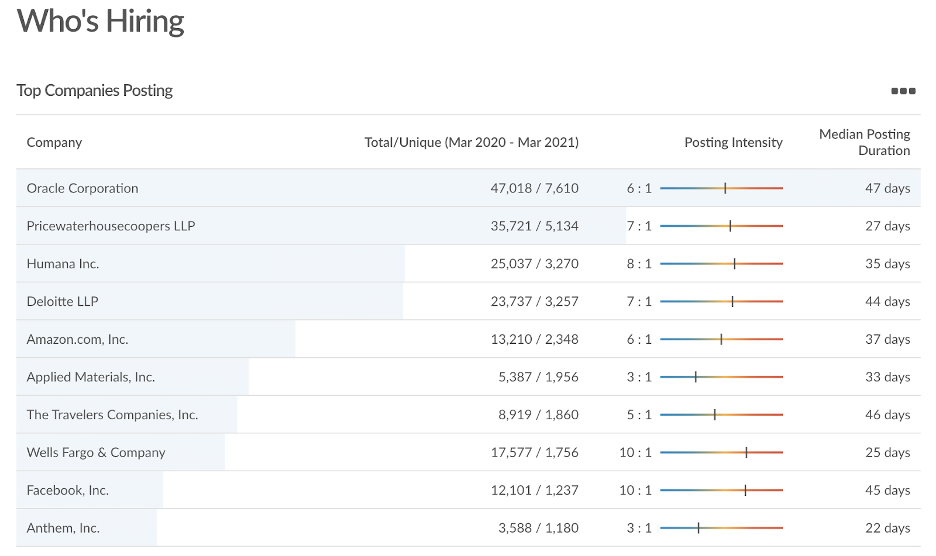
Source: Emsi Job Posting Analytics
Top job titles
Now we’ll look at the specific job titles asking for this skill. We see that data scientist is the most common, followed by data analysts and, further down, data engineers (the same three roles we profiled in our previous post on top skills for data jobs). No shock there.
But we also see evidence of data visualization’s utility in a day-to-day business context with titles like business intelligence analysts, business intelligence engineers and business analysts. These roles may not require the same level of in-depth statistical modeling or programming knowledge that a data scientist position would, but they do important work by translating data to actionable insight that can drive business decisions.
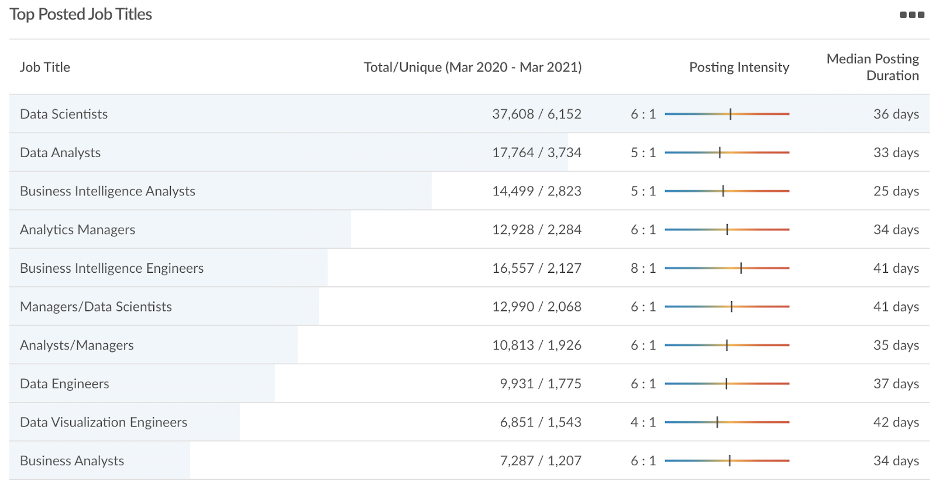
Source: Emsi Job Posting Analytics
BEST PRACTICE ALERT
Right now, we’re doing a skill-based analysis, which shows us the most common job titles requiring data visualization. As we’ve seen, the top title is “data scientist.” But it would be a mistake to assume that data visualization is therefore the most important skill for a data scientist to have.
Think of it this way. Doing a skill-based analysis of the labor market is a bit like doing an ingredient-based analysis of food. If you filter a food database based on the ingredient “pepperoni,” you’re likely to get “pizza” as a top meal result. Makes sense; pizza is a common way to use that ingredient.
But is pepperoni the most important ingredient for making pizza? Not really. In fact, it’s downright optional for people who prefer anchovies.
Instead, if you do a meal-based analysis (starting with “pizza” rather than a single ingredient), you’d see more essential things like dough, tomato sauce, and cheese at the top of the in-demand ingredients list. Pepperonis will show up eventually. But not at the very top.
Likewise with labor market analysis. If we start our search with a skill, we see the job roles where that skill is commonly in demand. But we then need to start with a job title to see where that skill falls in the overall hierarchy of other abilities needed for a given role.
It’s not that one perspective is right or wrong. Both are important for knowing how to design curriculum and deliver advising that helps students achieve the career outcomes they want.
To see the difference this makes, we can compare the top skills for a data scientist vs. a business intelligence analyst.
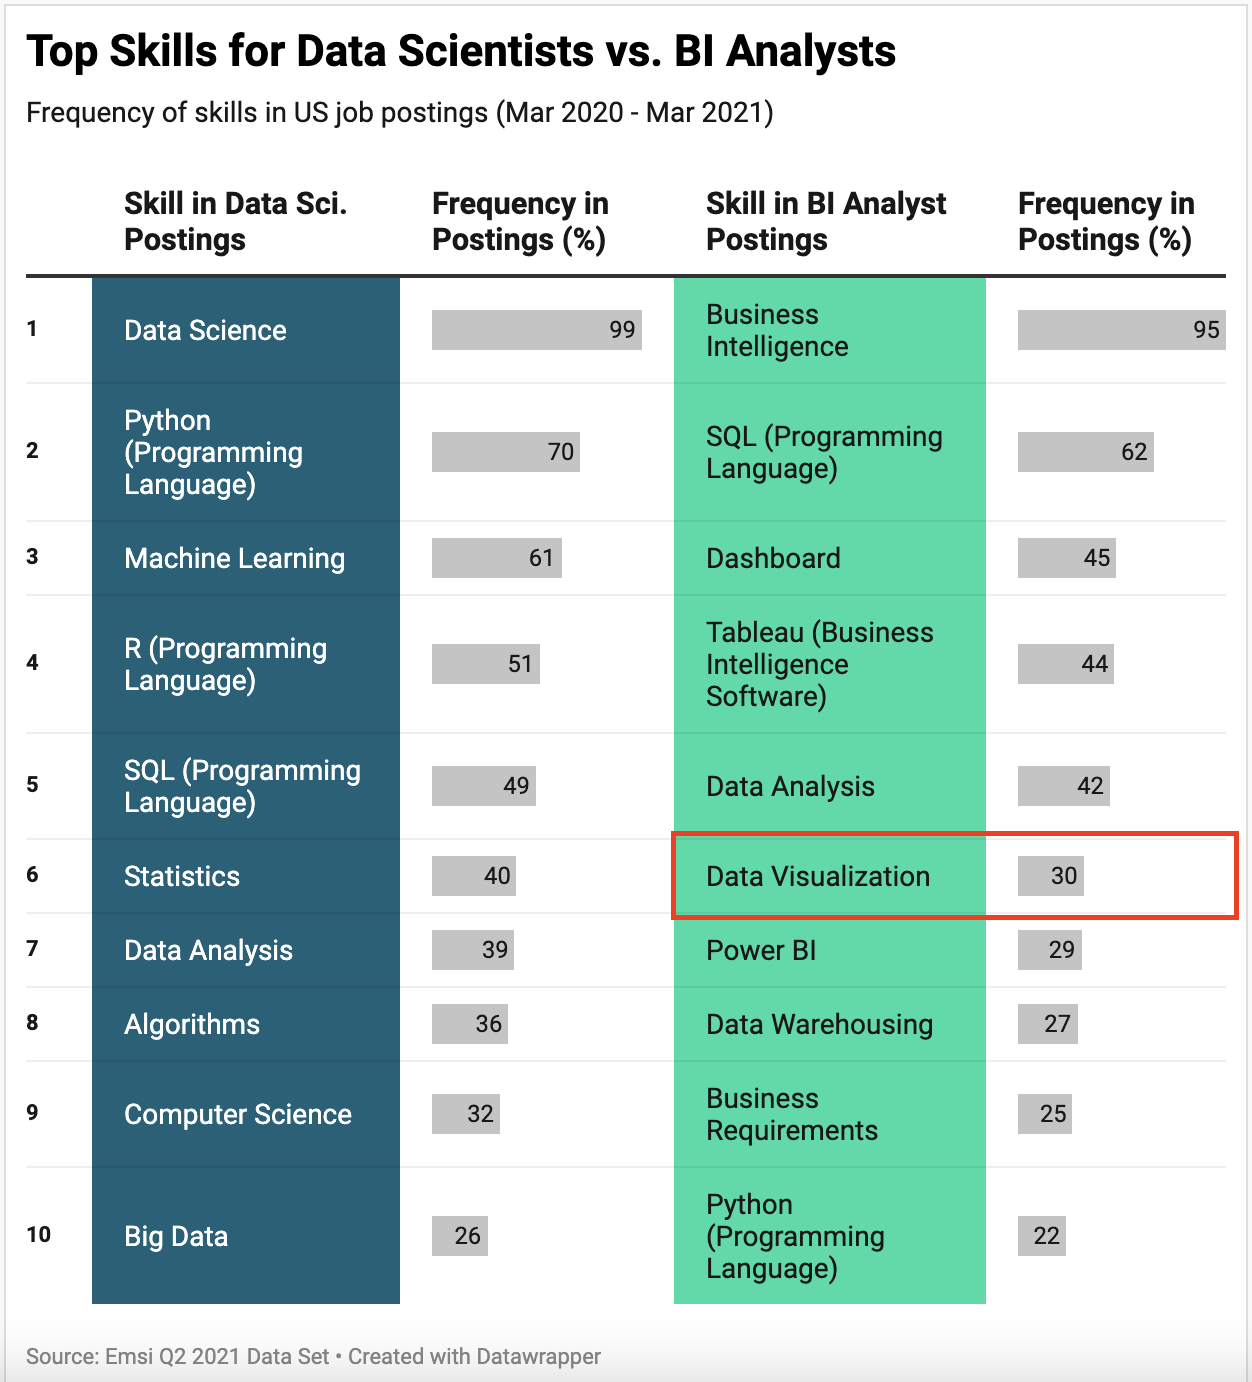
Notice that data visualization is in the top 10 skills for BI analyst postings, but not data scientist postings. So, if you’re educating students for a business intelligence role, you’ll definitely want to teach data visualization. If you’re preparing them to pursue data science opportunities, data visualization is a useful and relevant concept, but other skills may be considered more essential to that work.
Related skills
These are the other skills that show up in postings that require data visualization (along with the percentage of professional profiles listing that skill, on the right).
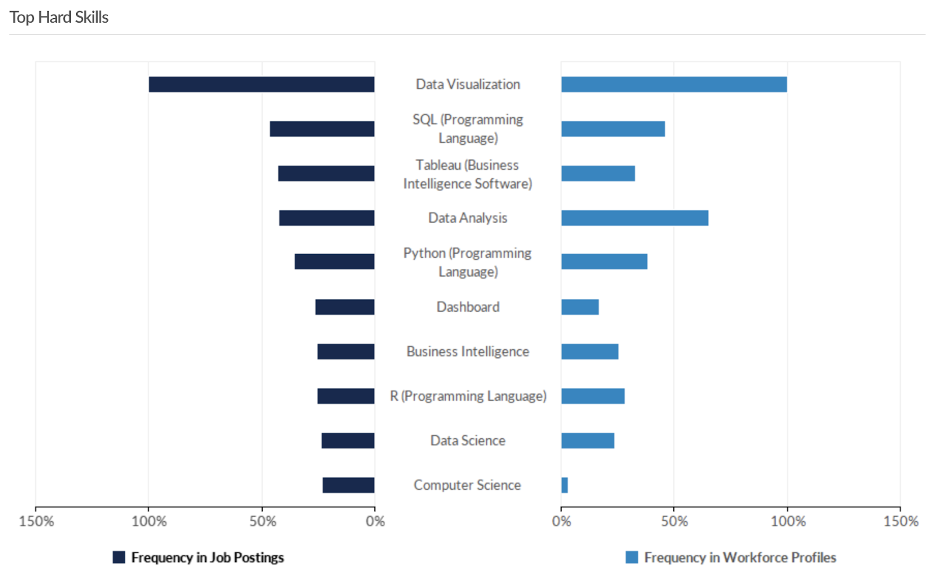
Source: Emsi Job Posting Analytics
These skills cluster into several categories which help us understand how data visualization relates to the labor market:
Specific programming languages (SQL, Python, R) that can be used to access, clean, and analyze data—work which often must be done before it can be visualized. (Note that Python and R can also be used to create visualizations).
Tableau—a specific software tool used to create visualizations, and Dashboard—a specific type of visualization often used in business settings to make actionable data accessible for decision makers. Seeing these two skills together also suggests that work-relevant coursework should include building dashboards in Tableau, which could also give students a nice portfolio piece to bolster their resume.
Data analysis, data science, and computer science are distinct, but related, domains of knowledge that can incorporate data visualization. Their presence in job postings suggests that the specific skill of visualization is most valuable when situated within the context of one of these broader disciplines.
BEST PRACTICE ALERT
Keep in mind that “data scientist” was the most common job title for the data visualization skill, so the above list of skills is likely to be heavily influenced by postings for that role. A good next step might be to filter out data scientist jobs (which we can do with two clicks in Analyst) to see how the list of top skills changes.
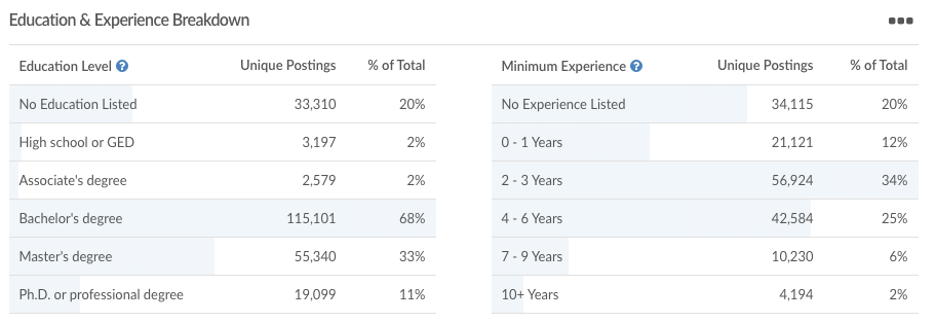
Required education level
Most job postings (68%) listing data visualization require at least a bachelor’s, with 33% indicating they prefer a master’s degree or above. We can also see that many of these jobs (34%) ask for 2-3 years experience. All the more reason to prioritize internship or co-op programs that give learners a leg up by way of real world work experience before they graduate.
Source: Emsi Job Posting Analytics
Market insight, made easy
With a single report in Analyst, we can begin to verify and clarify market demand for data visualization. Equipped with this insight, deans, department chairs, and others can make informed decisions on how to build programs that deliver relevant skills and learning experiences, so that learners can achieve their career goals.
If you’re interested in having 24/7 access to reports like this, check out Analyst or get in touch with us. We’d love to hear more about the work you’re doing and explore how our data can help.


