For the artistically inclined, the business world doesn’t always seem like a comfortable fit. But graphic design is one area where creativity can translate to a rewarding career path — one that blends visual storytelling with bottom-line impact, helping companies communicate ideas, influence audiences, and build recognizable brands.
At some point, though, many designers start to ask: What’s next? How can they build on their creative strengths to earn more, lead bigger projects, or have a greater say in shaping a brand’s direction? And, in light of AI-driven labor market disruption, designers may be motivated to upskill into roles that accentuate the distinctly human work of design strategy and leadership.
That’s where higher education can play a role. By using labor market insight to identify the skill gaps — and overlaps — between graphic designers and more senior creative roles, colleges and universities can develop high-impact credentials that unlock pathways to growth for artistic professionals.
In this article, we’ll show how the Career Pathways report, in Analyst, helps institutions do this in just a few clicks — from identifying next-step jobs, to analyzing skill gaps, to pinpointing the key transitional skills professionals need to pull off their next career move.
Identifying Next-Step Jobs for Graphic Designers
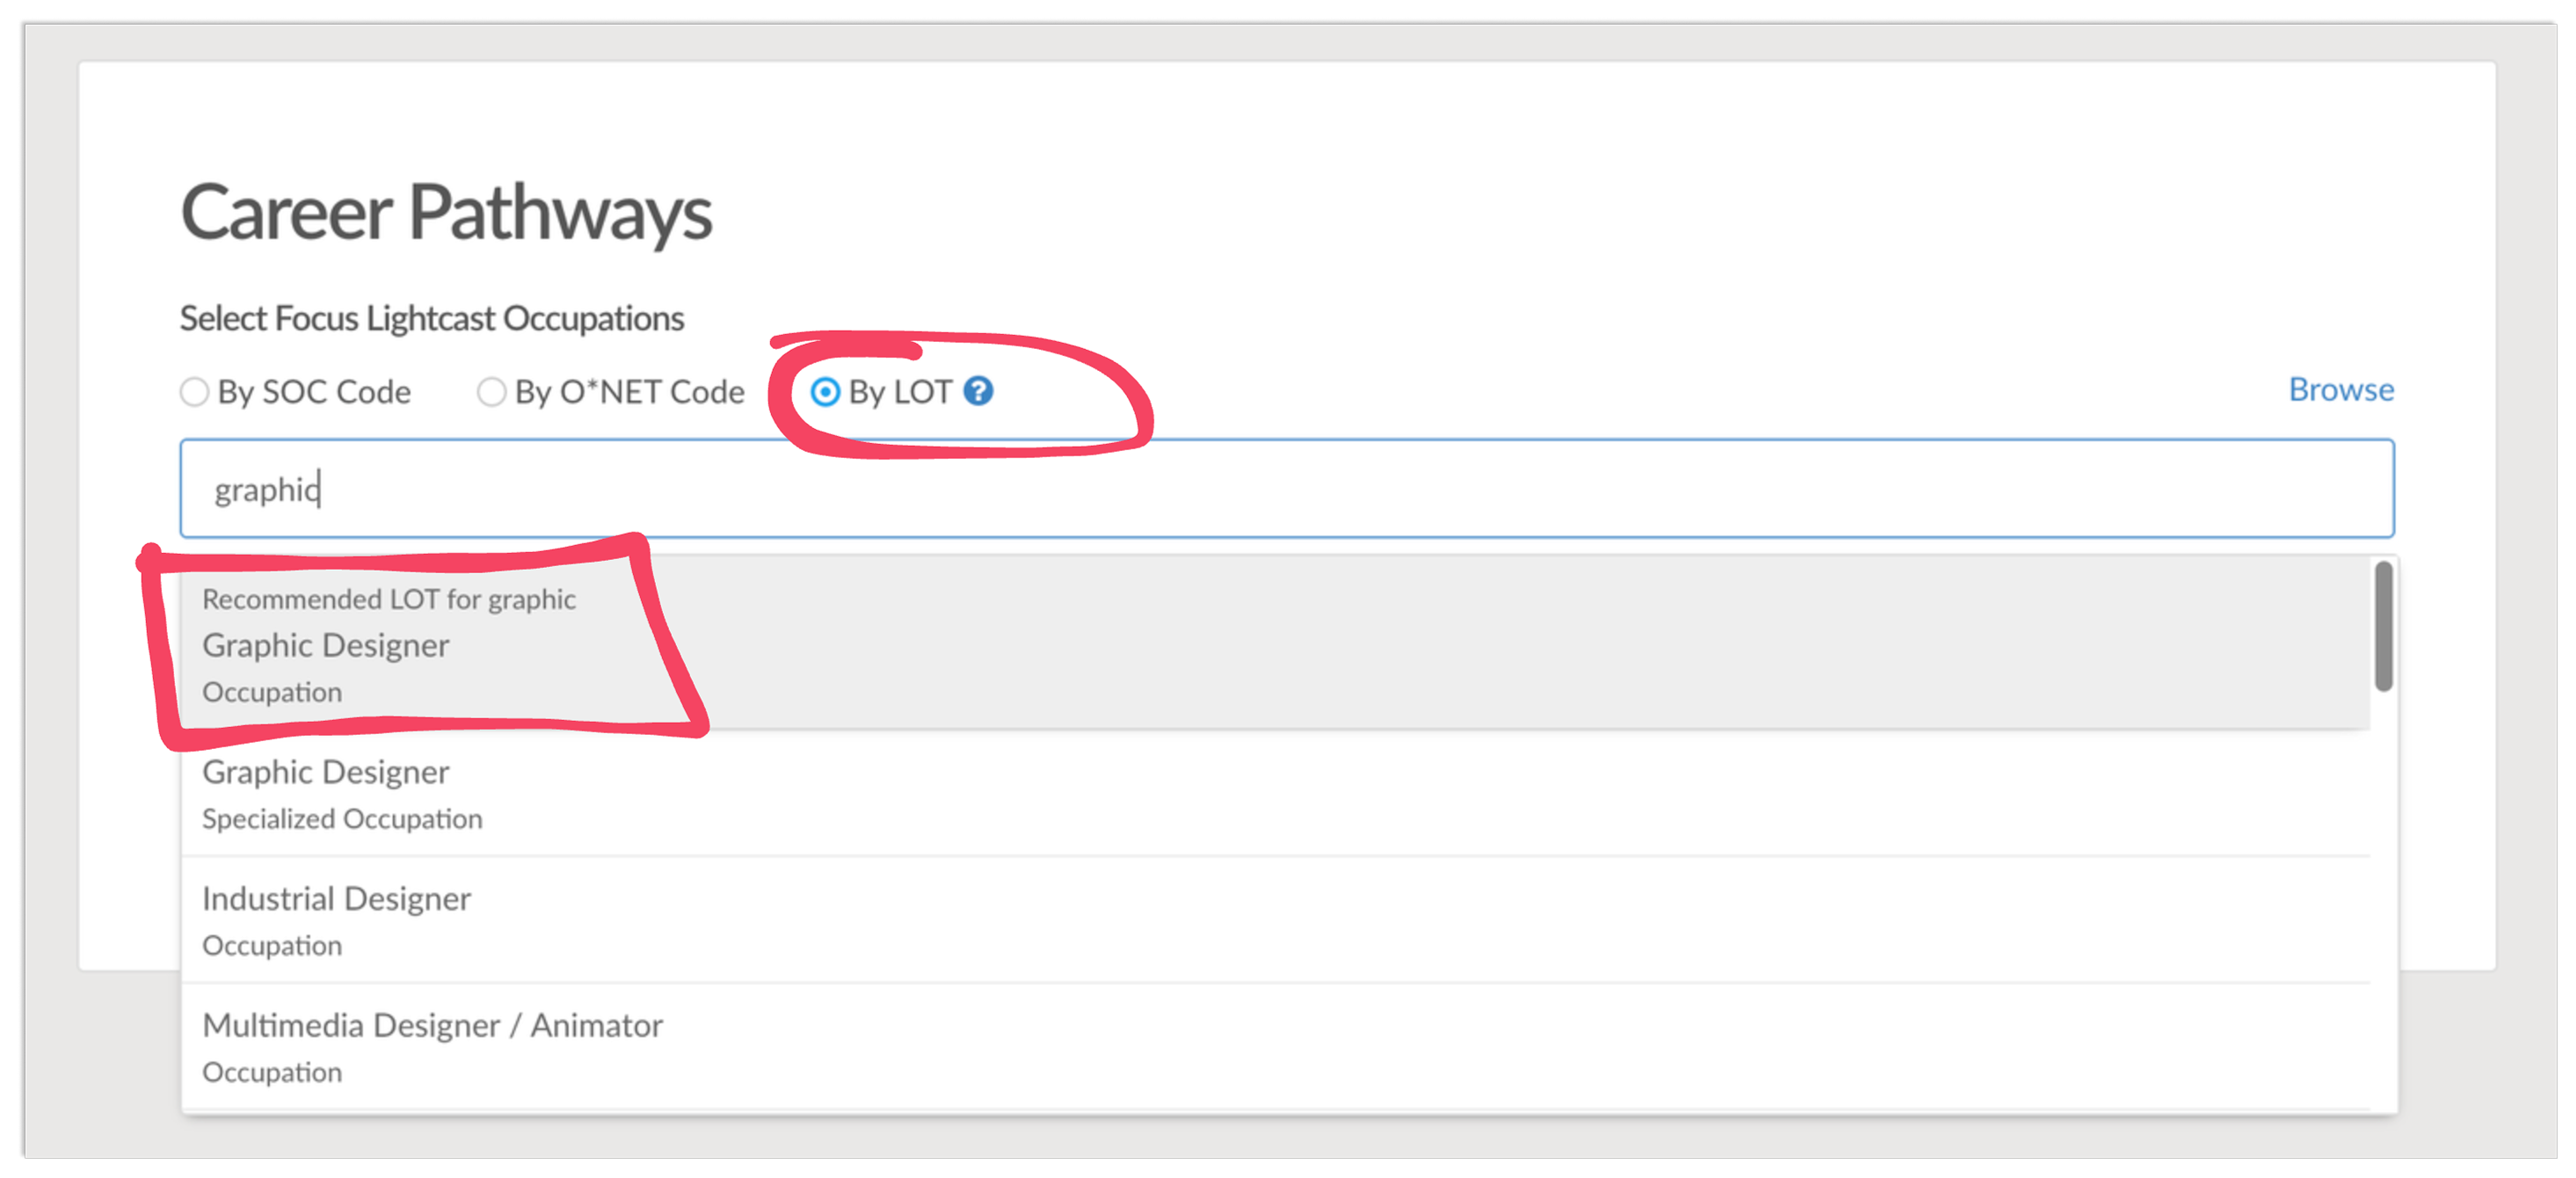
After logging into Analyst and navigating to the Career Pathways Report, we’ll start by selecting Graphic Designer as our Focus Occupation.
(In this example, we’re using the Lightcast Occupation Taxonomy, so we can take full advantage of its unique strengths, but we could also do this analysis using SOC codes or O*NET codes if desired.)
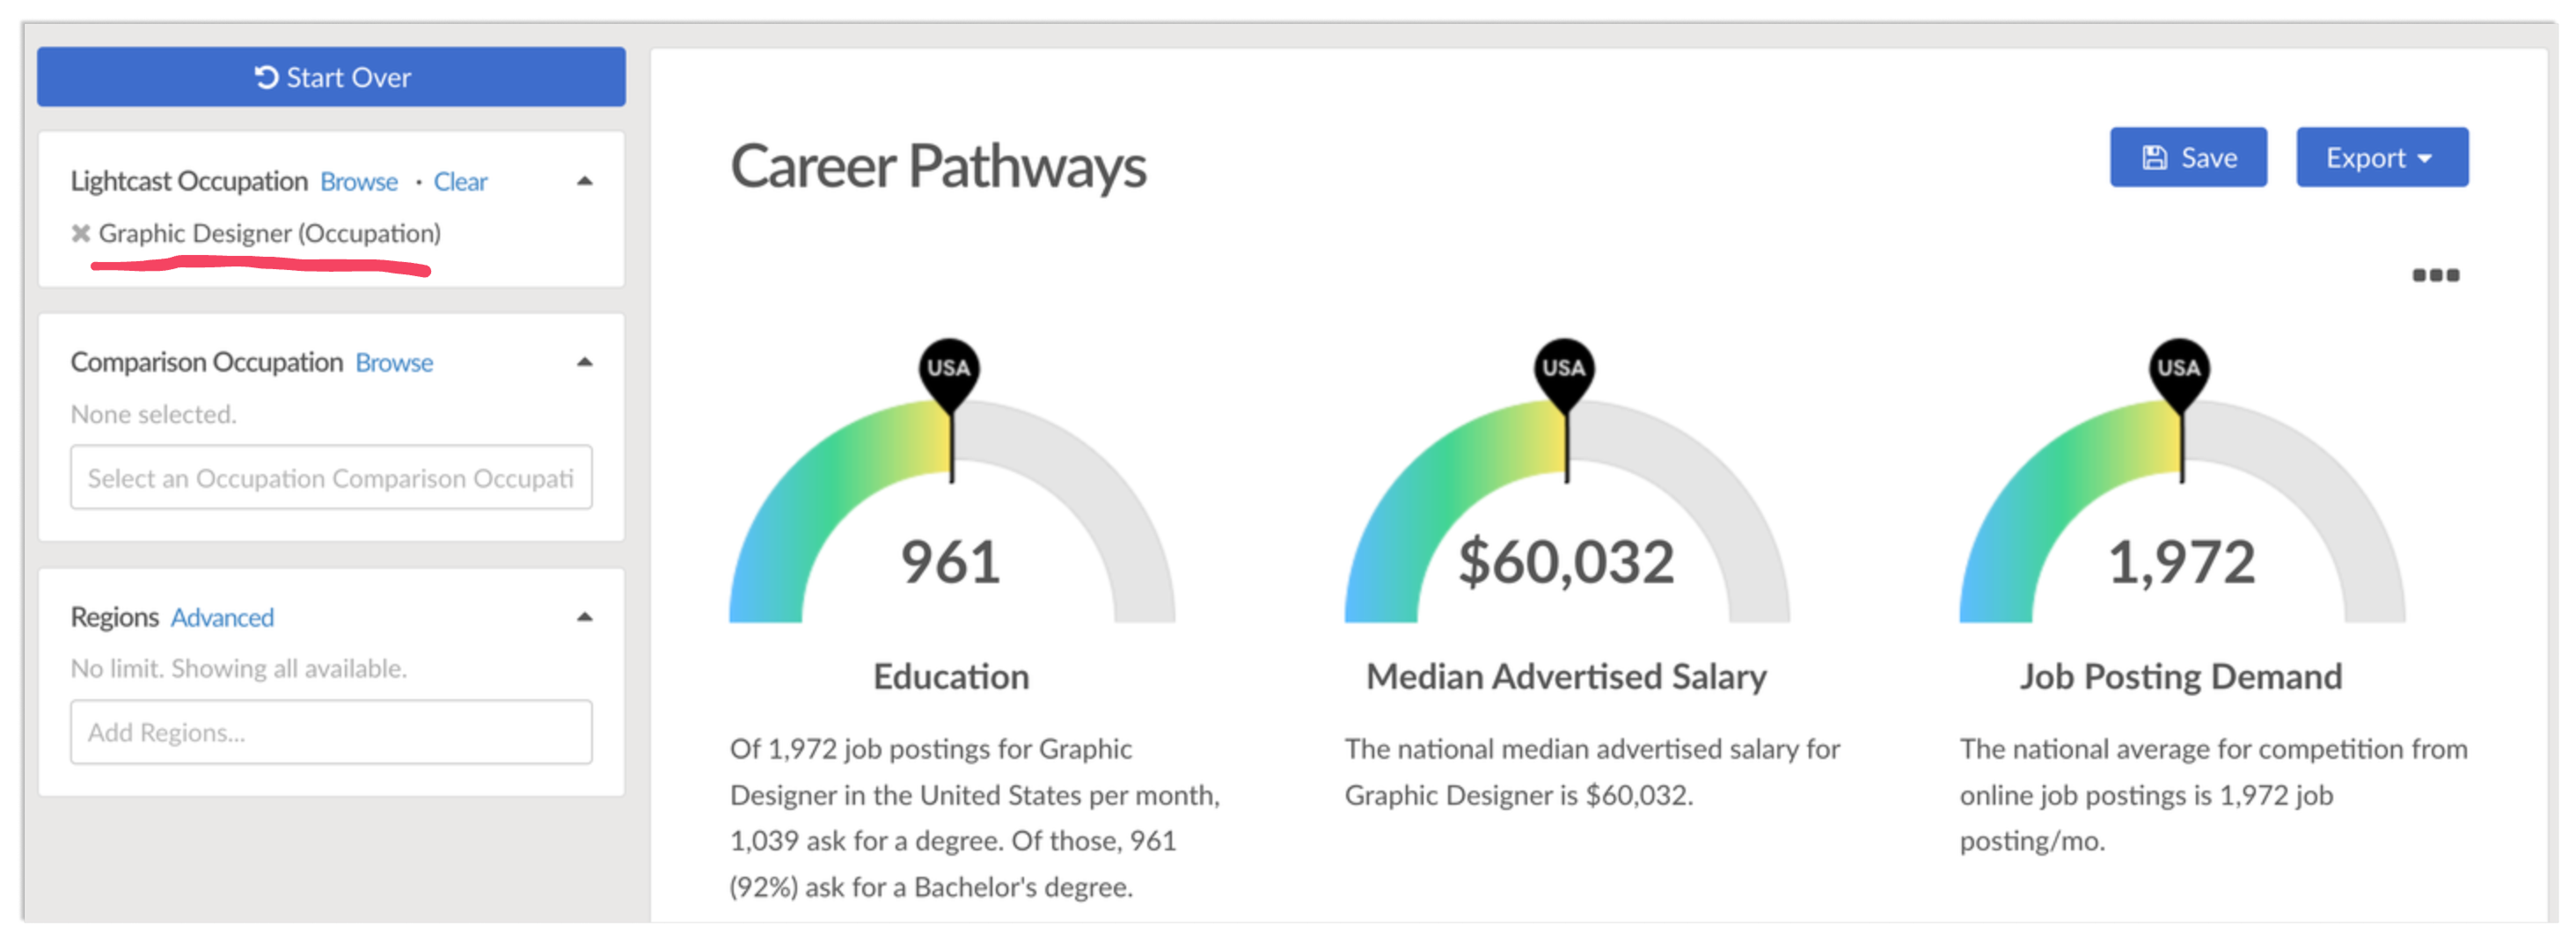
We’ll leave the region filter blank for now, to run a nationwide analysis. For your institution, you may want to limit this to your service region, city, or state.
After running the report, we’re greeted by a dashboard of key metrics for our selected occupation, based on employer job postings over the past 12 months. The “speedometer” graphics show how our selected region compares to national benchmarks for each metric (since our selected region is the nation, they all match the benchmark. That would change if we narrowed our analysis to a specific city, county, state, etc.)
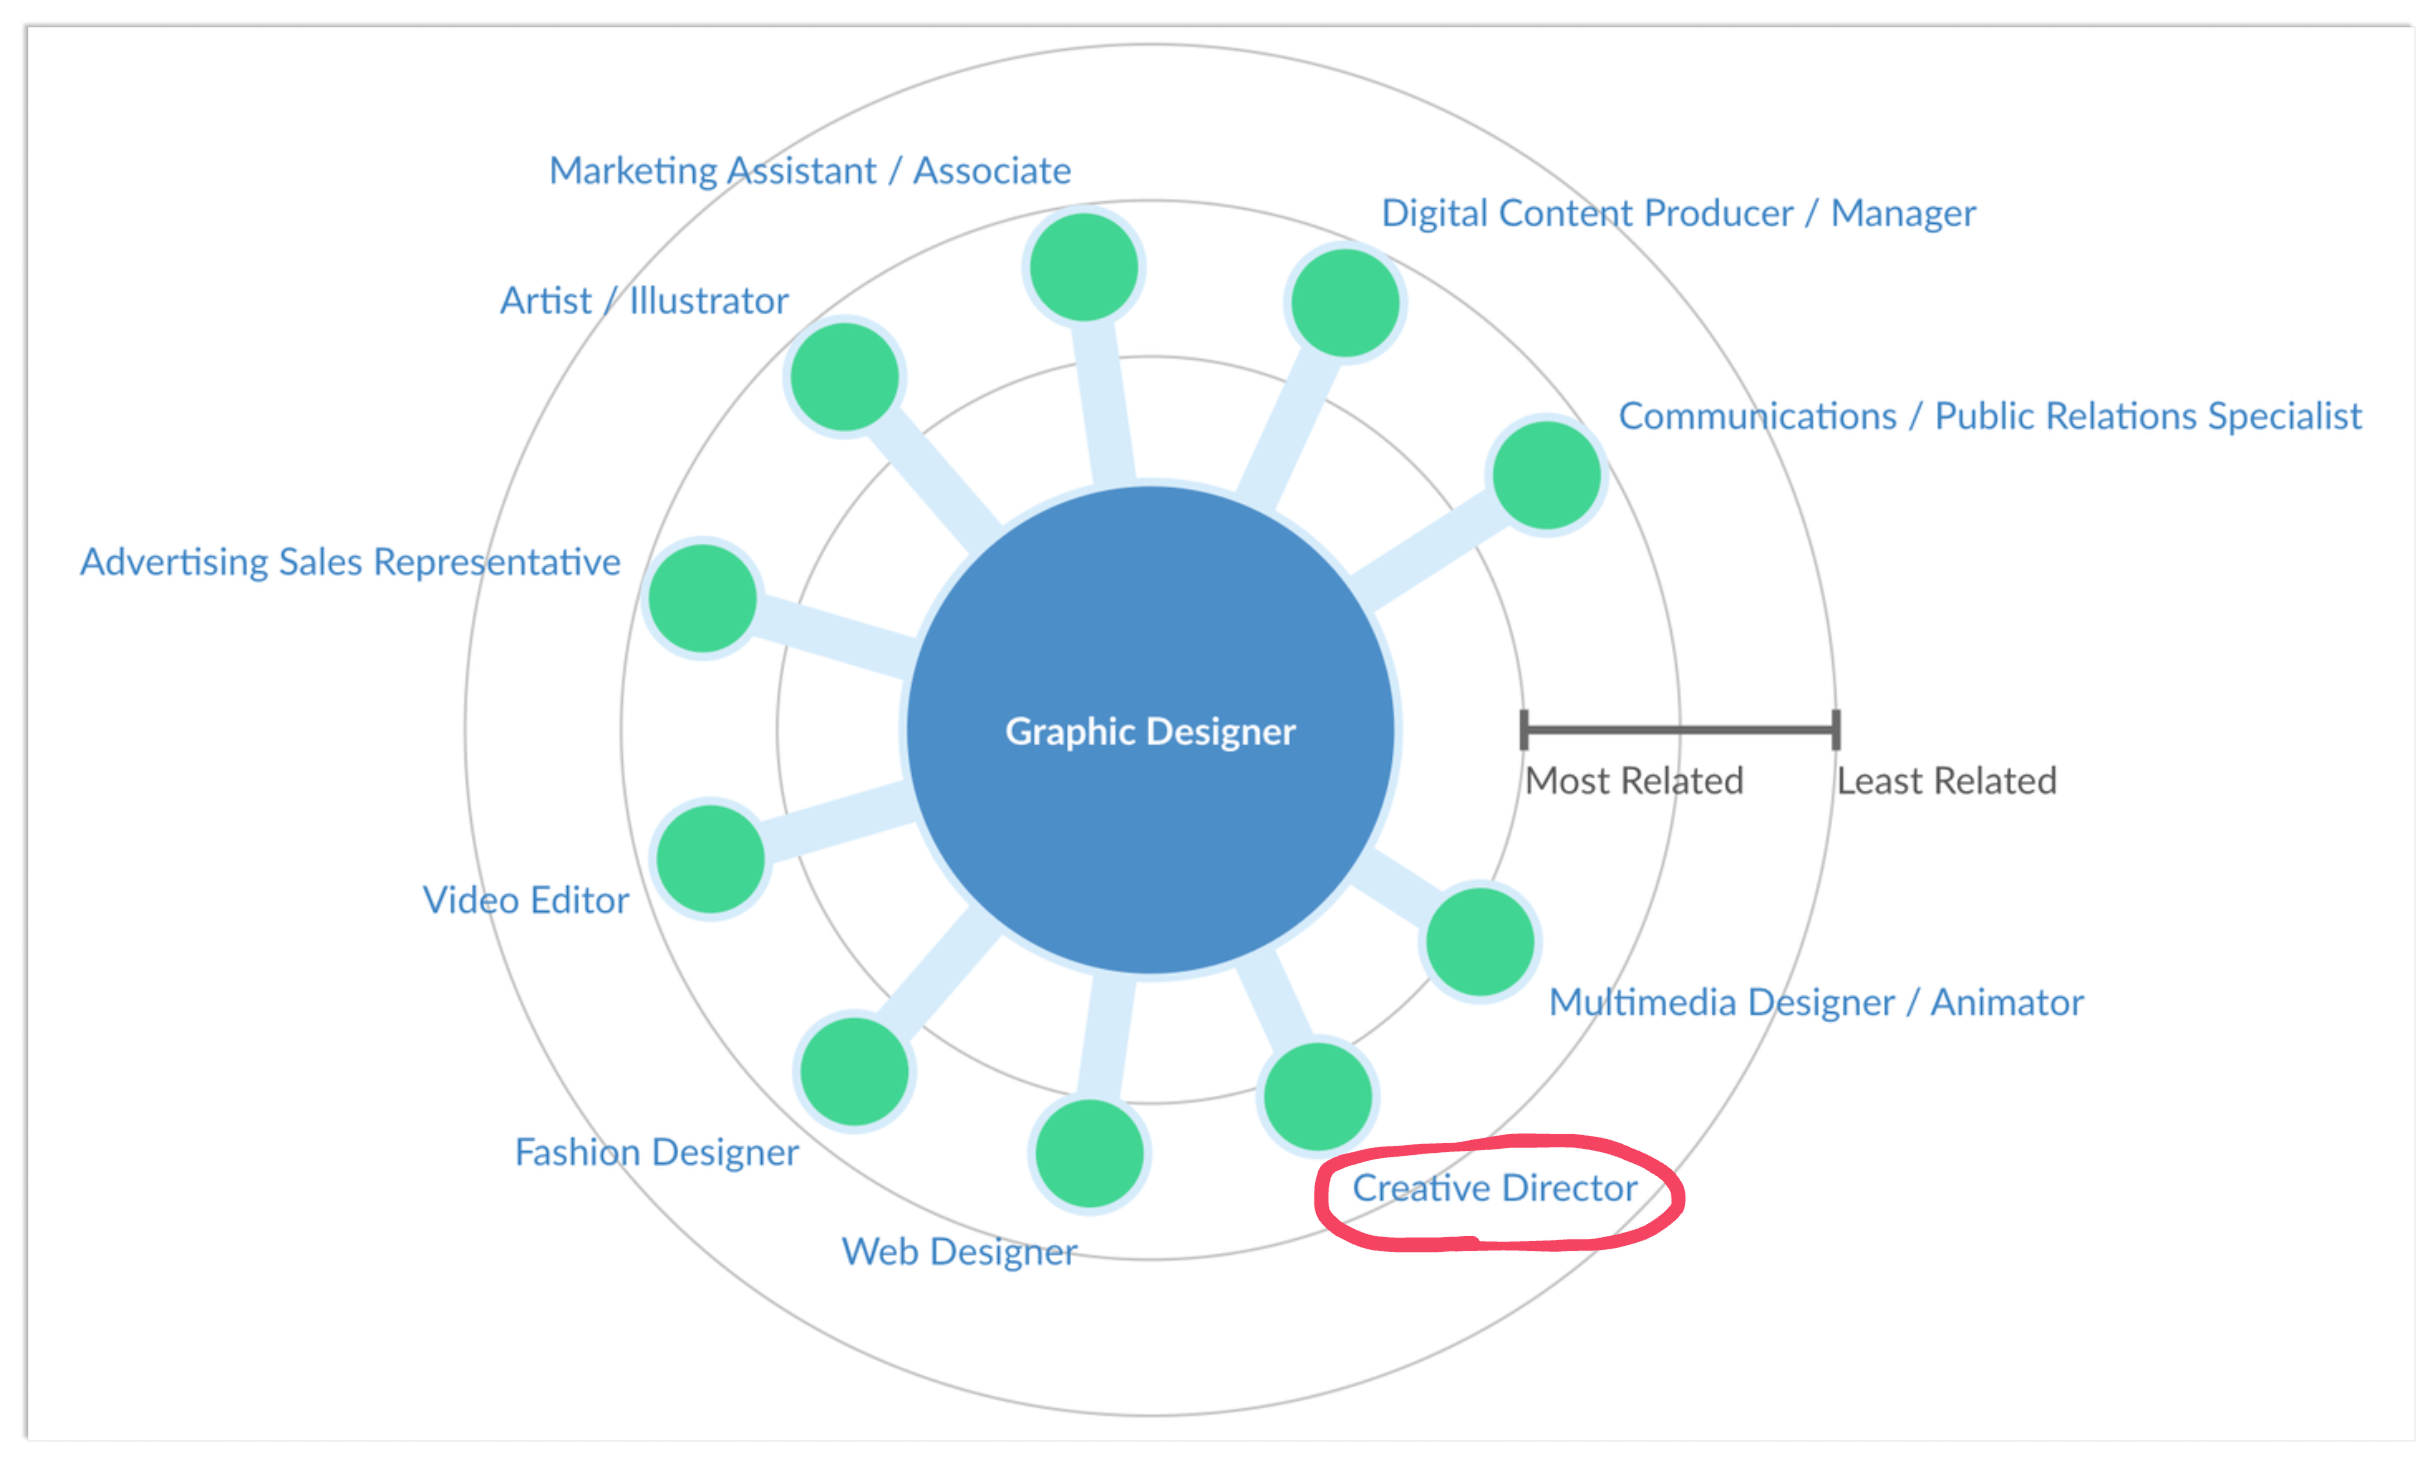
Immediately below this is the chart we’re looking for: A set of concentric circles that show 10 next-step jobs for a Graphic Designer, ranked from most related to least related, based on the similarity and importance of skills required for each role.
In this example, we’re focused on exploring upskilling opportunities to help graphic designers advance into strategic leadership roles — like Creative Director! So it’s encouraging to see that occupation listed as the second most similar next-step job, suggesting this is a feasible job transition.
NOTE: If we wanted to also explore reskilling pathways — like helping desigerns pivot into animation or video editing roles — we could easily do so in this same report. We'd simply repeat the following steps, but select a different next-stop job for our Comparison Occupation.
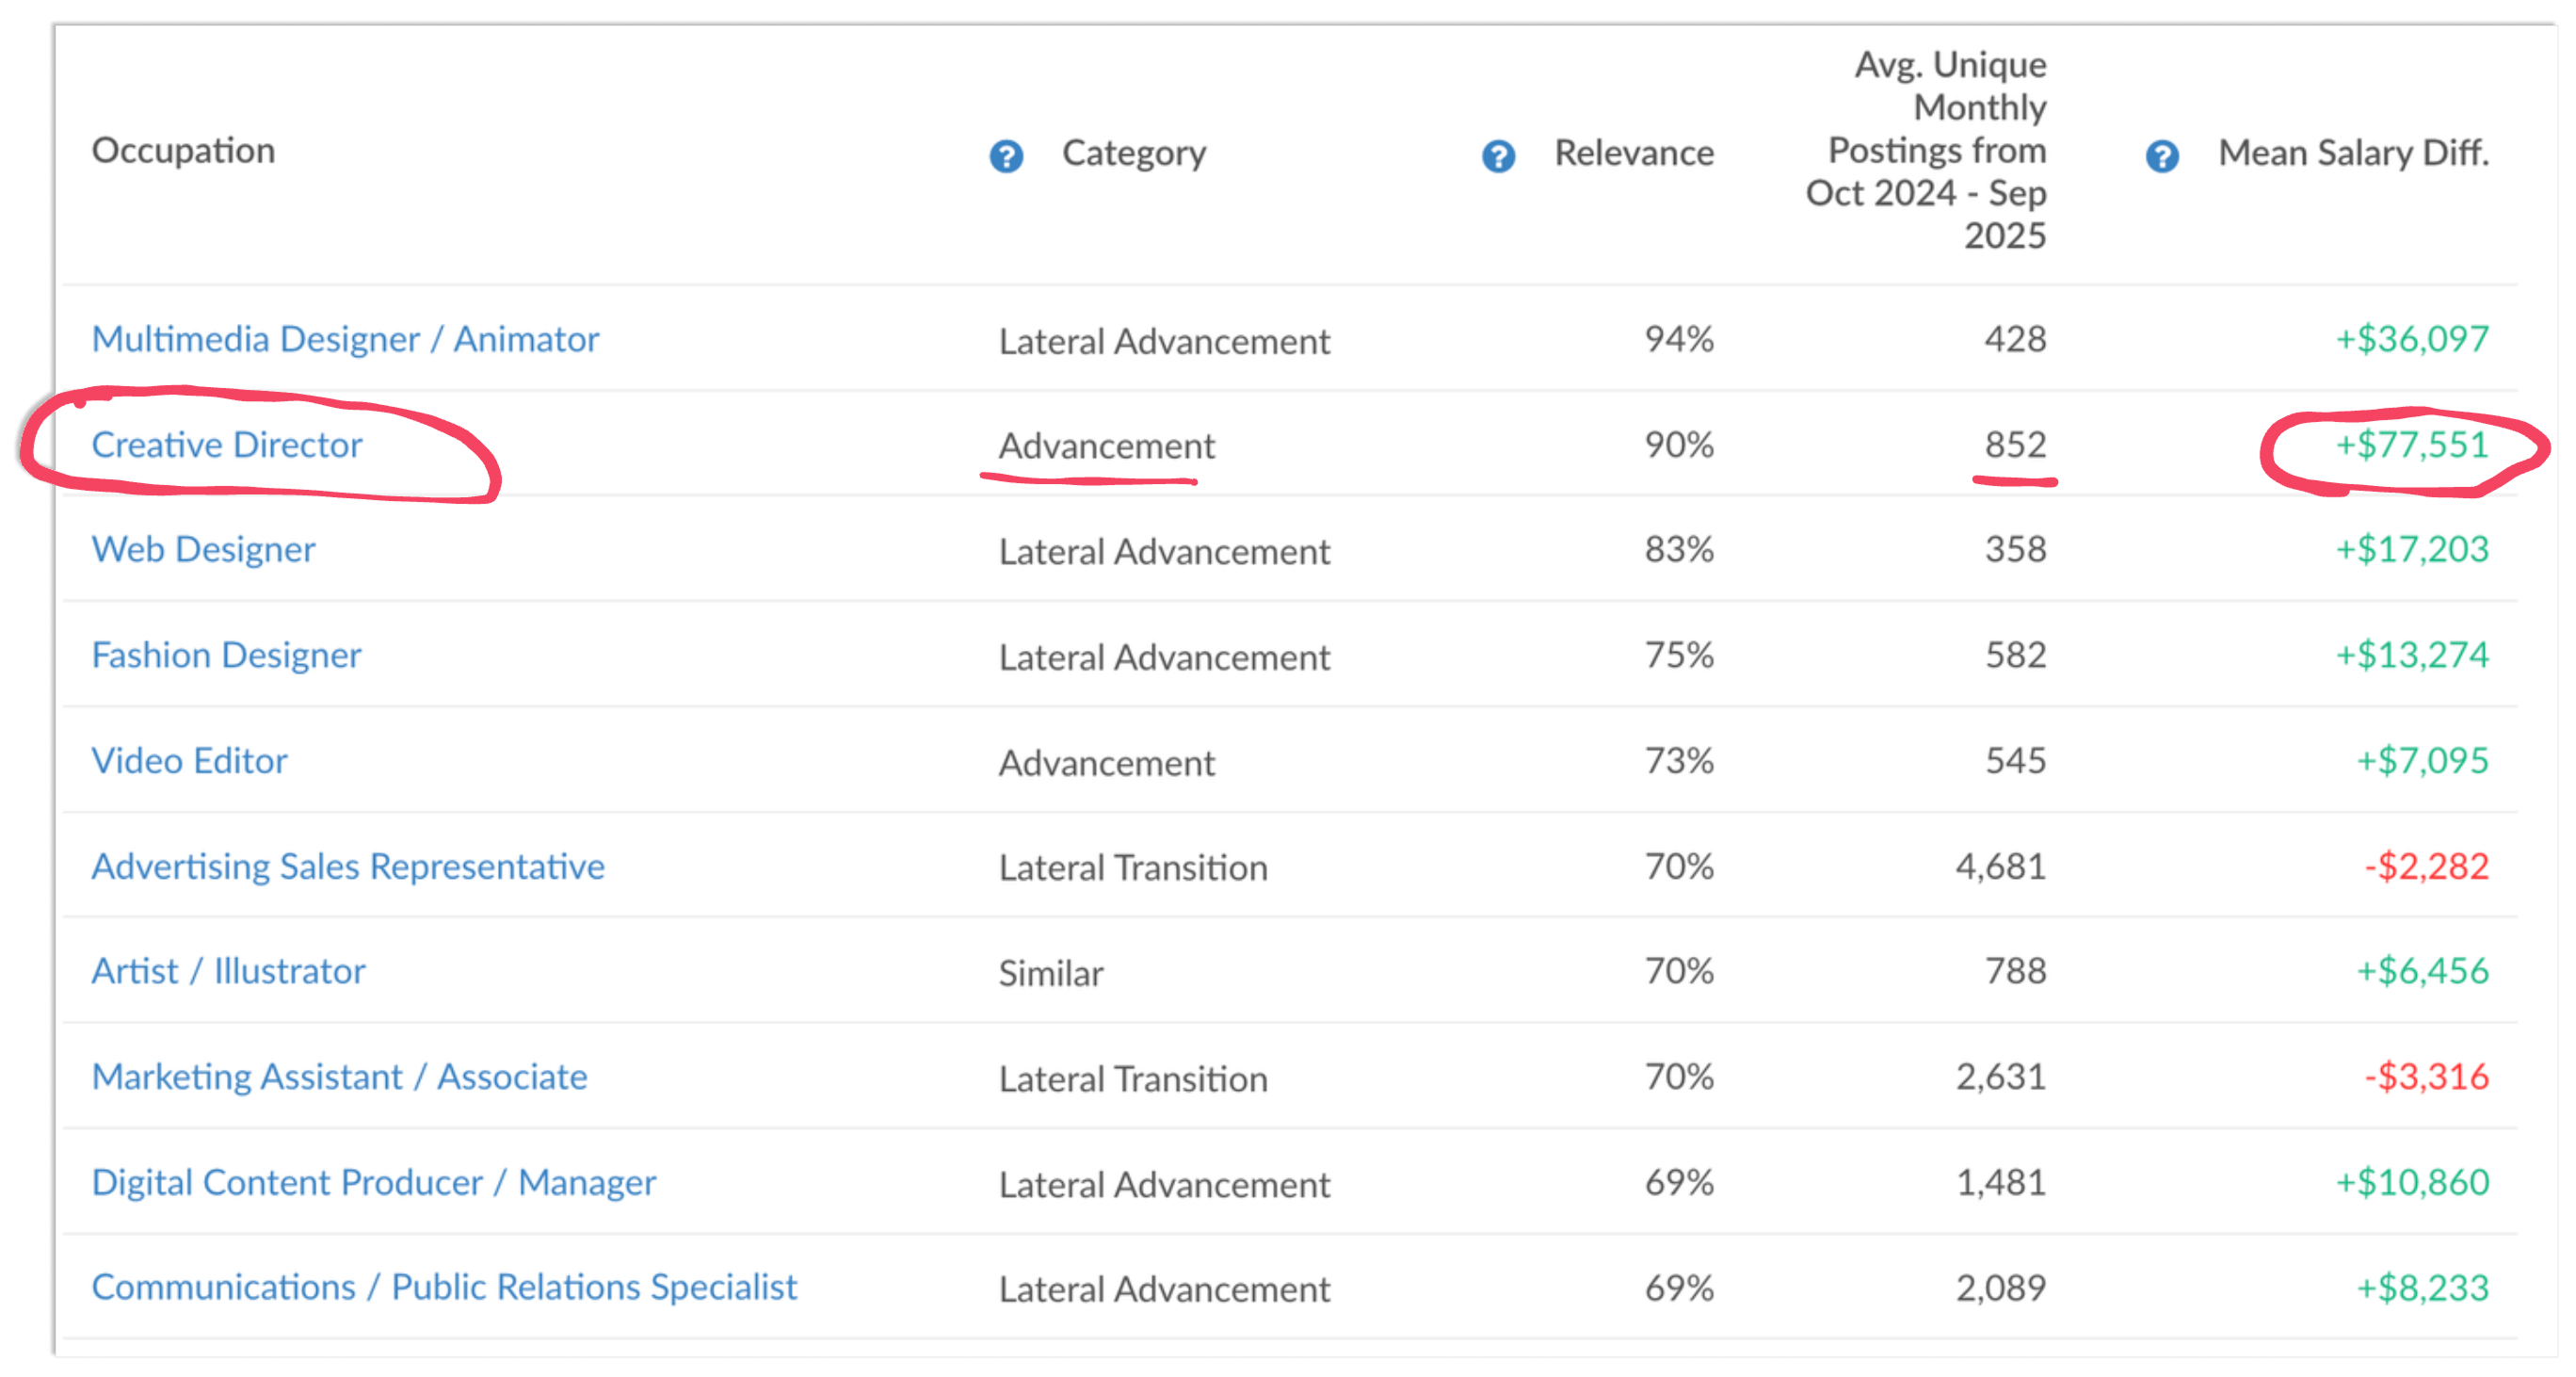
Scrolling down in the report, we see more detailed analysis of the relationship between our focus occupation (Graphic Designer) and these next step jobs — including salary data, job posting volume, and the type of transition involved in moving from one role to the next (Advancement, Lateral, Similar, etc.)
With this data, we can see that the average salary advertised in job postings for Creative Director roles over the past 12 months is $77K higher than the average salary advertised in Graphic Design postings — a substantial increase!
We also see there were 852 unique job postings (meaning they've been cleaned and de-duplicated) for these roles over that same time period — an encouraging sign that employers are actively hiring to fill Creative Director openings.
Analyzing Skill Gaps and Transitional Skills
Once we select Creative Director as our comparison occupation (by clicking on it in either the circle chart or the table), Analyst generates two new sets of insights that may be the most valuable, actionable parts of the Career Pathways report.
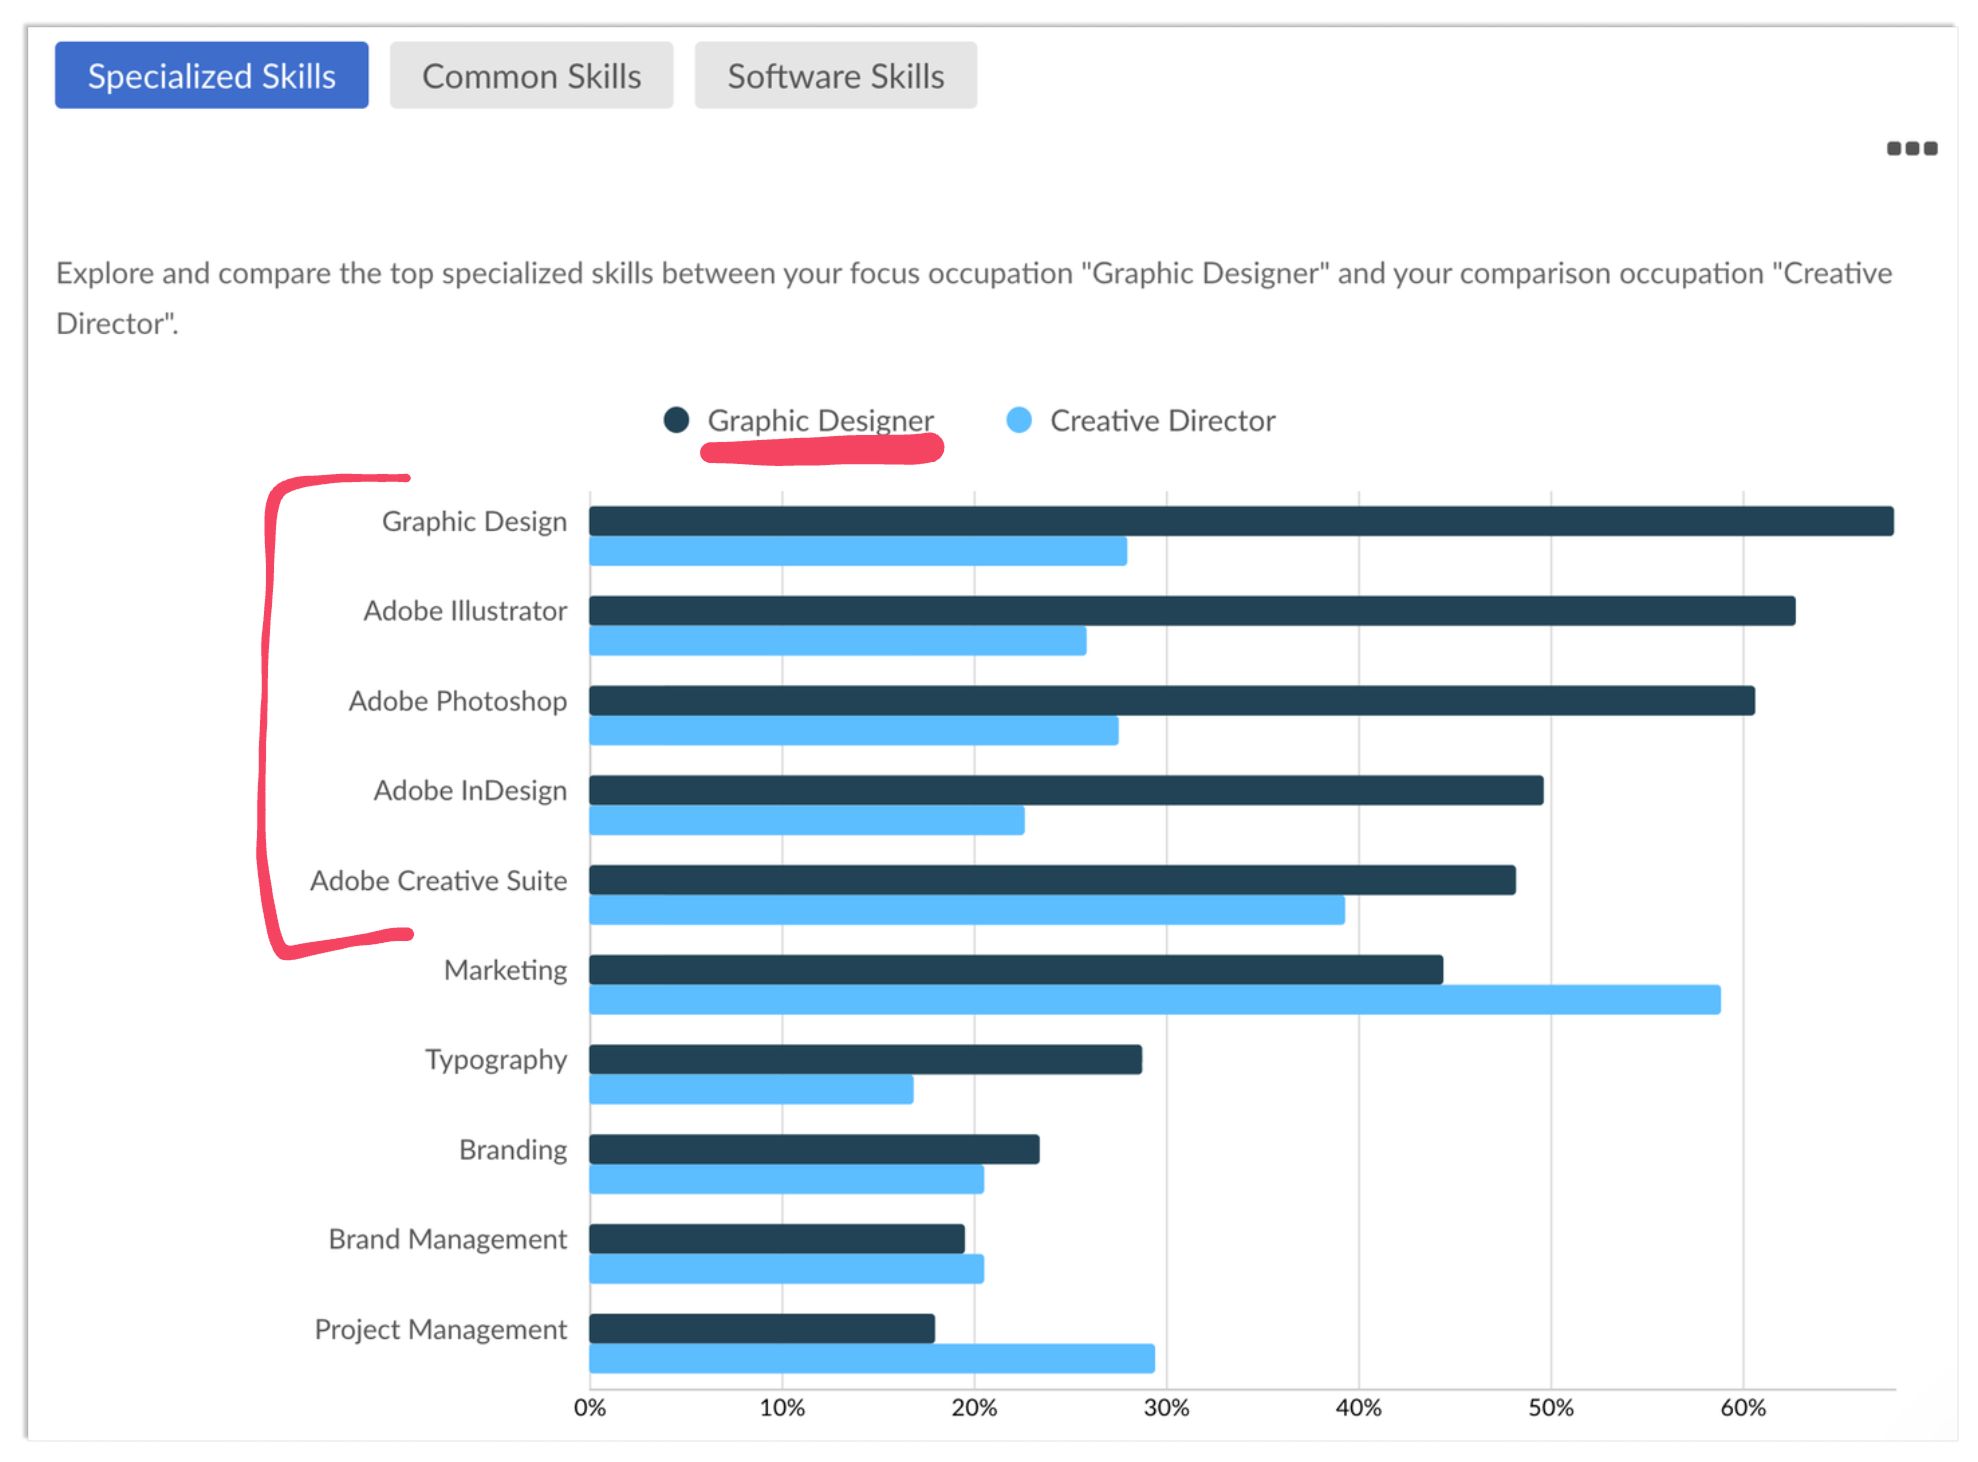
First, we see a list of the top 10 in-demand skills for our focus occupation (Graphic Designer) with dark blue bars showing the percentage of job postings that request each skill. These are accompanied by light blue bars, showing the percentage of postings for the comparison occupation — in this case, Creative Director — requesting those same skills.
This graph helps us quickly analyze the relative importance of these skills for the two roles, and how demand for our next-step job may differ in important ways from the skills designers developed in their current role.
For example, we see that the core skills for a design practitioner, like Graphic Design and the tools that are part of the Adobe creative suite, are relatively more in demand for Graphic Designer jobs than Creative Director jobs.
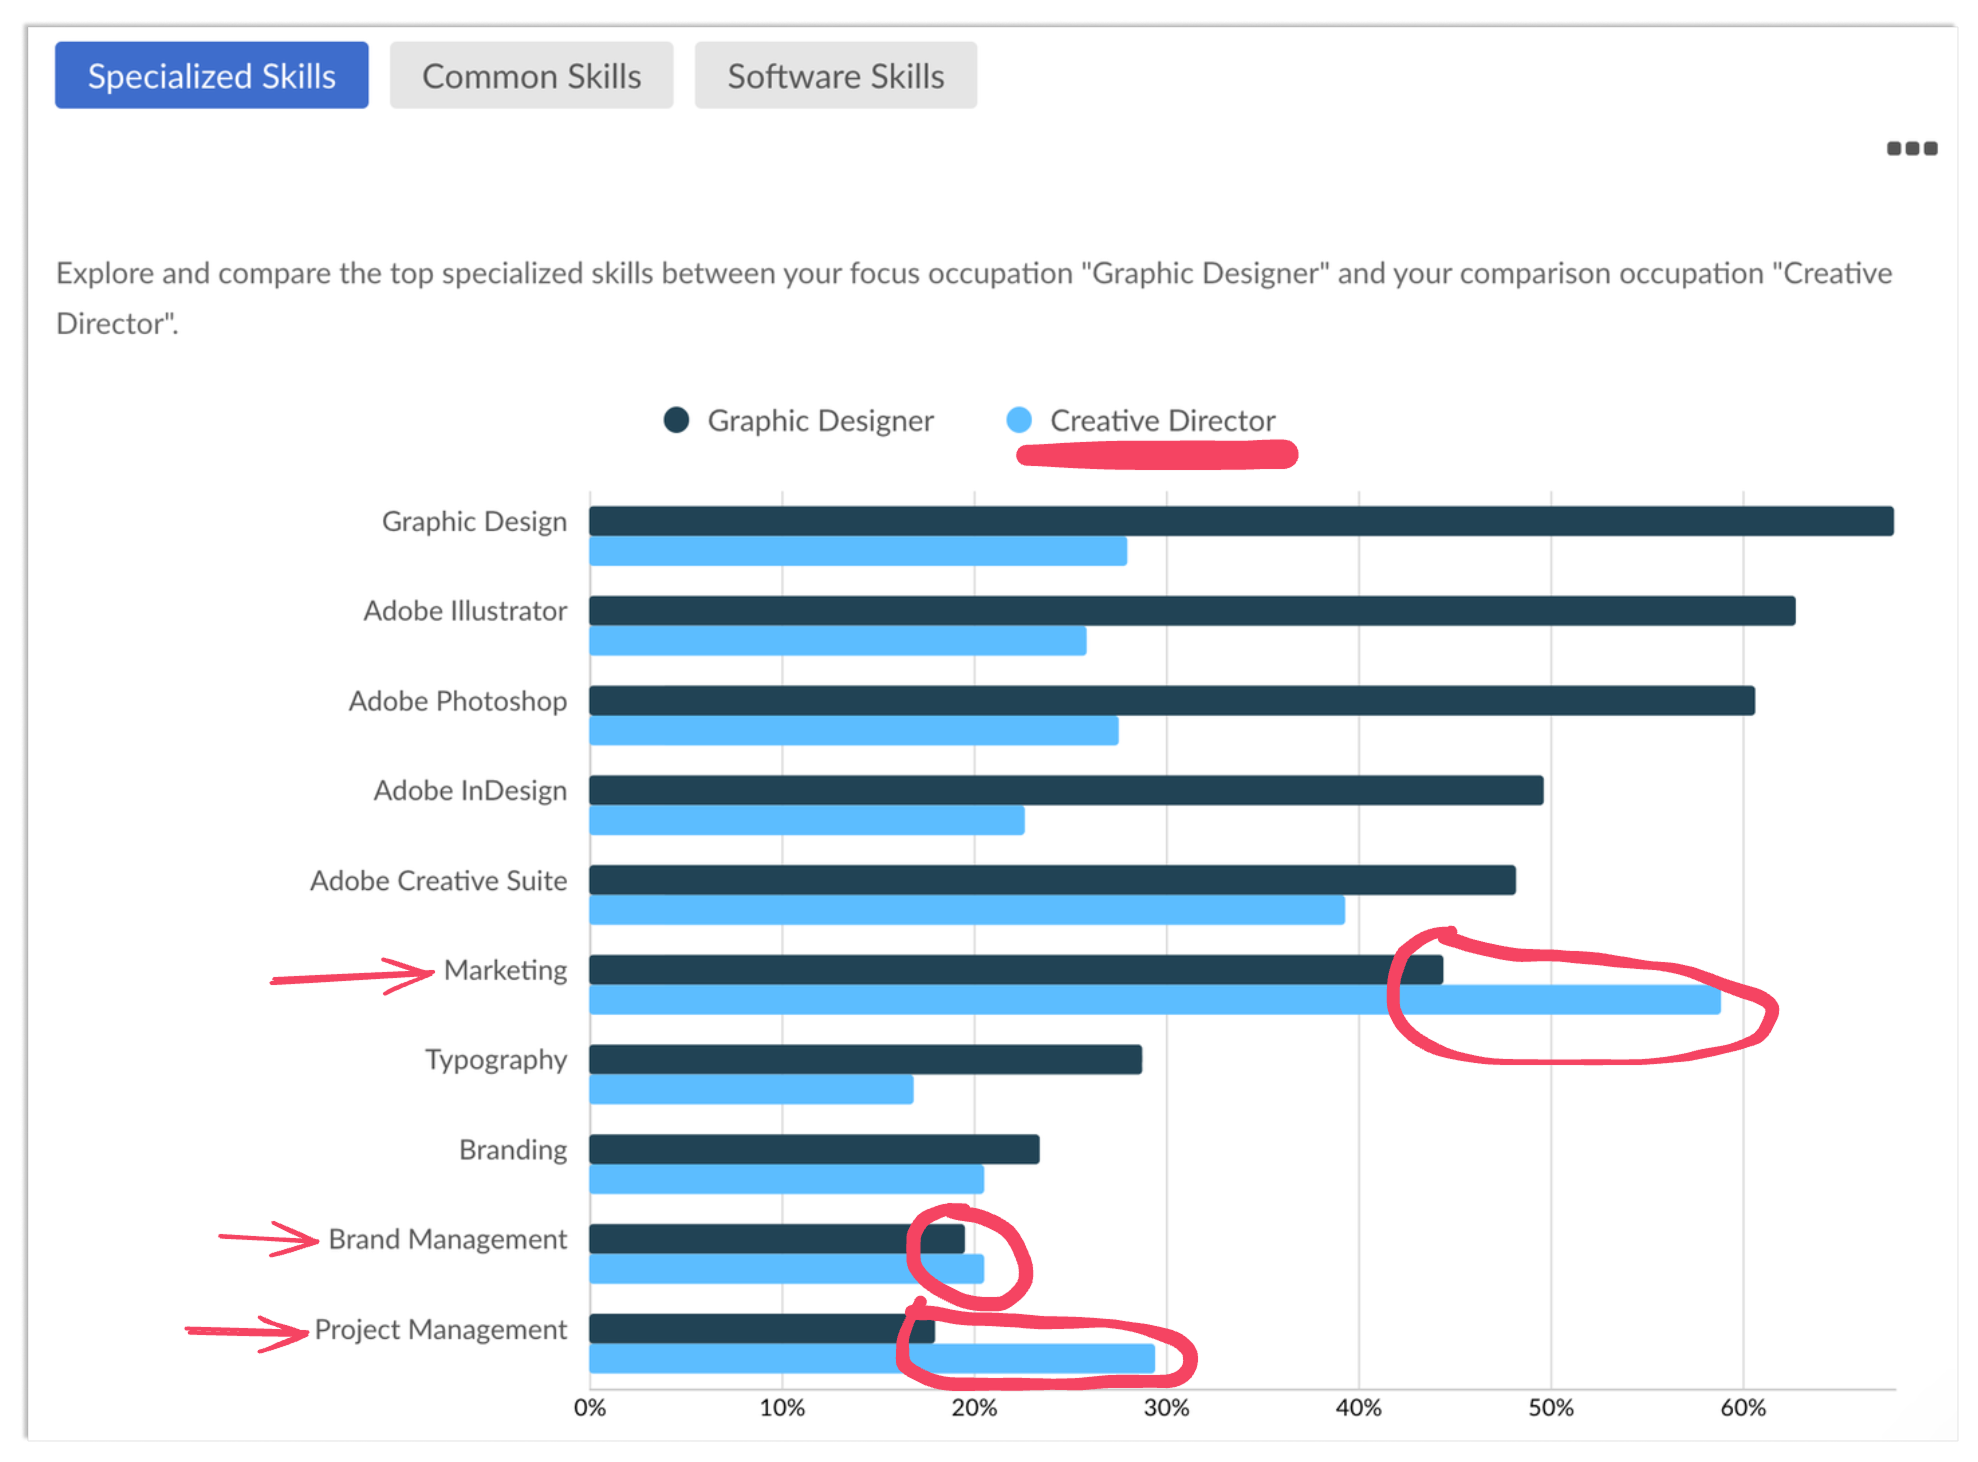
By contrast, Creative Director job postings (the light blue bars), show higher demand for skills like Marketing, Brand Management, and Project Management — skills that transcend the hands-on work of “doing design” and instead focus on aligning design work with business objectives, and leading a team of designers to achieve goals within budgetary and time constraints.
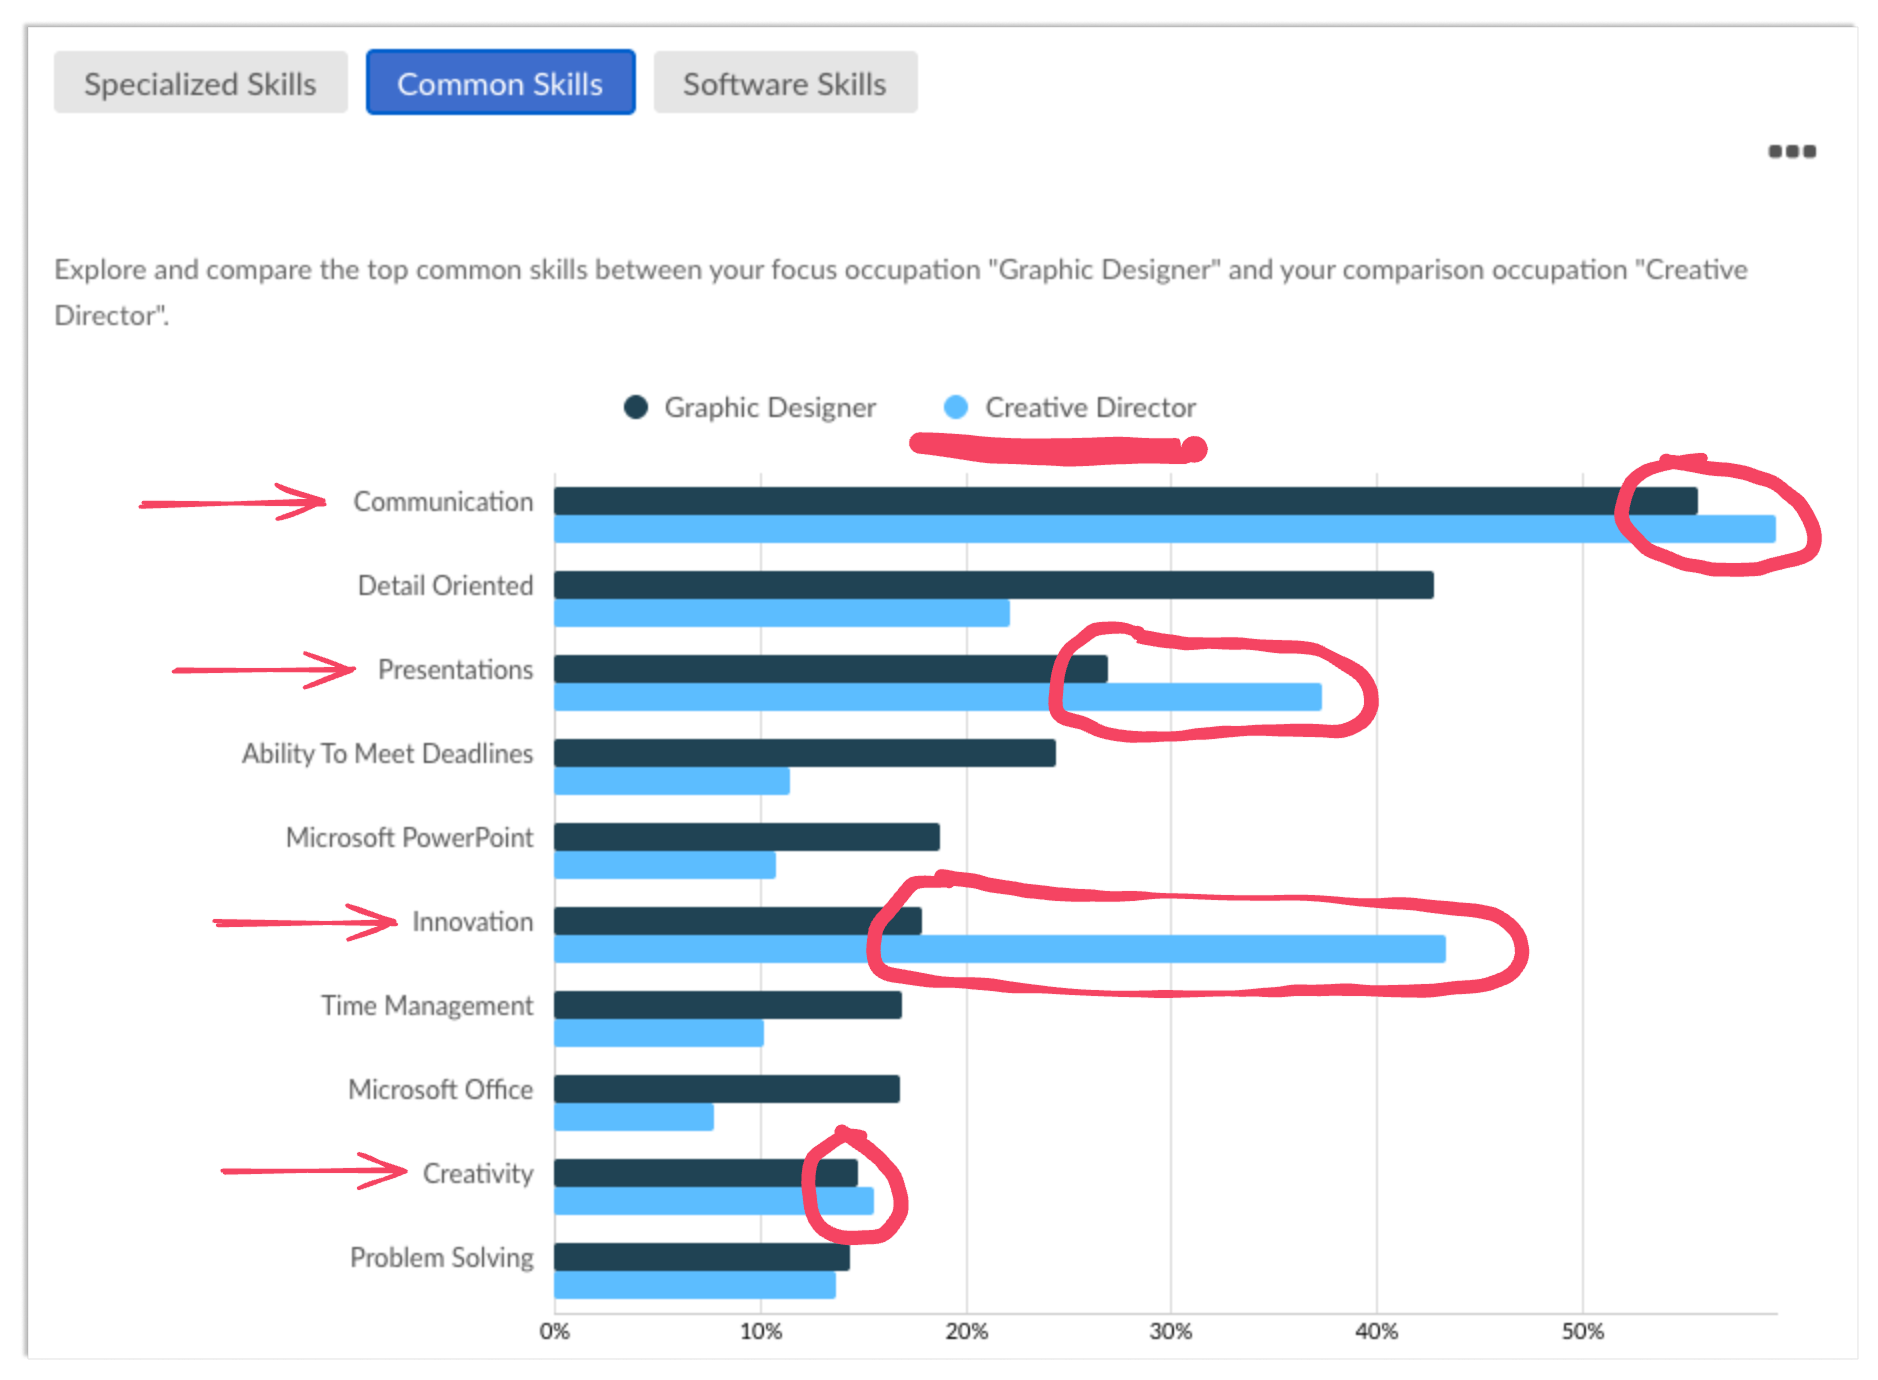
We can also toggle over to the Common Skills section of this same chart to see how Creative Director jobs emphasize skills like Communication and Presentations (skills required to represent the vision, value, and impact of design work at the executive level), as well as Innovation and Creativity (skills required to architect marketing campaigns that stand out from the noise in a competitive market).
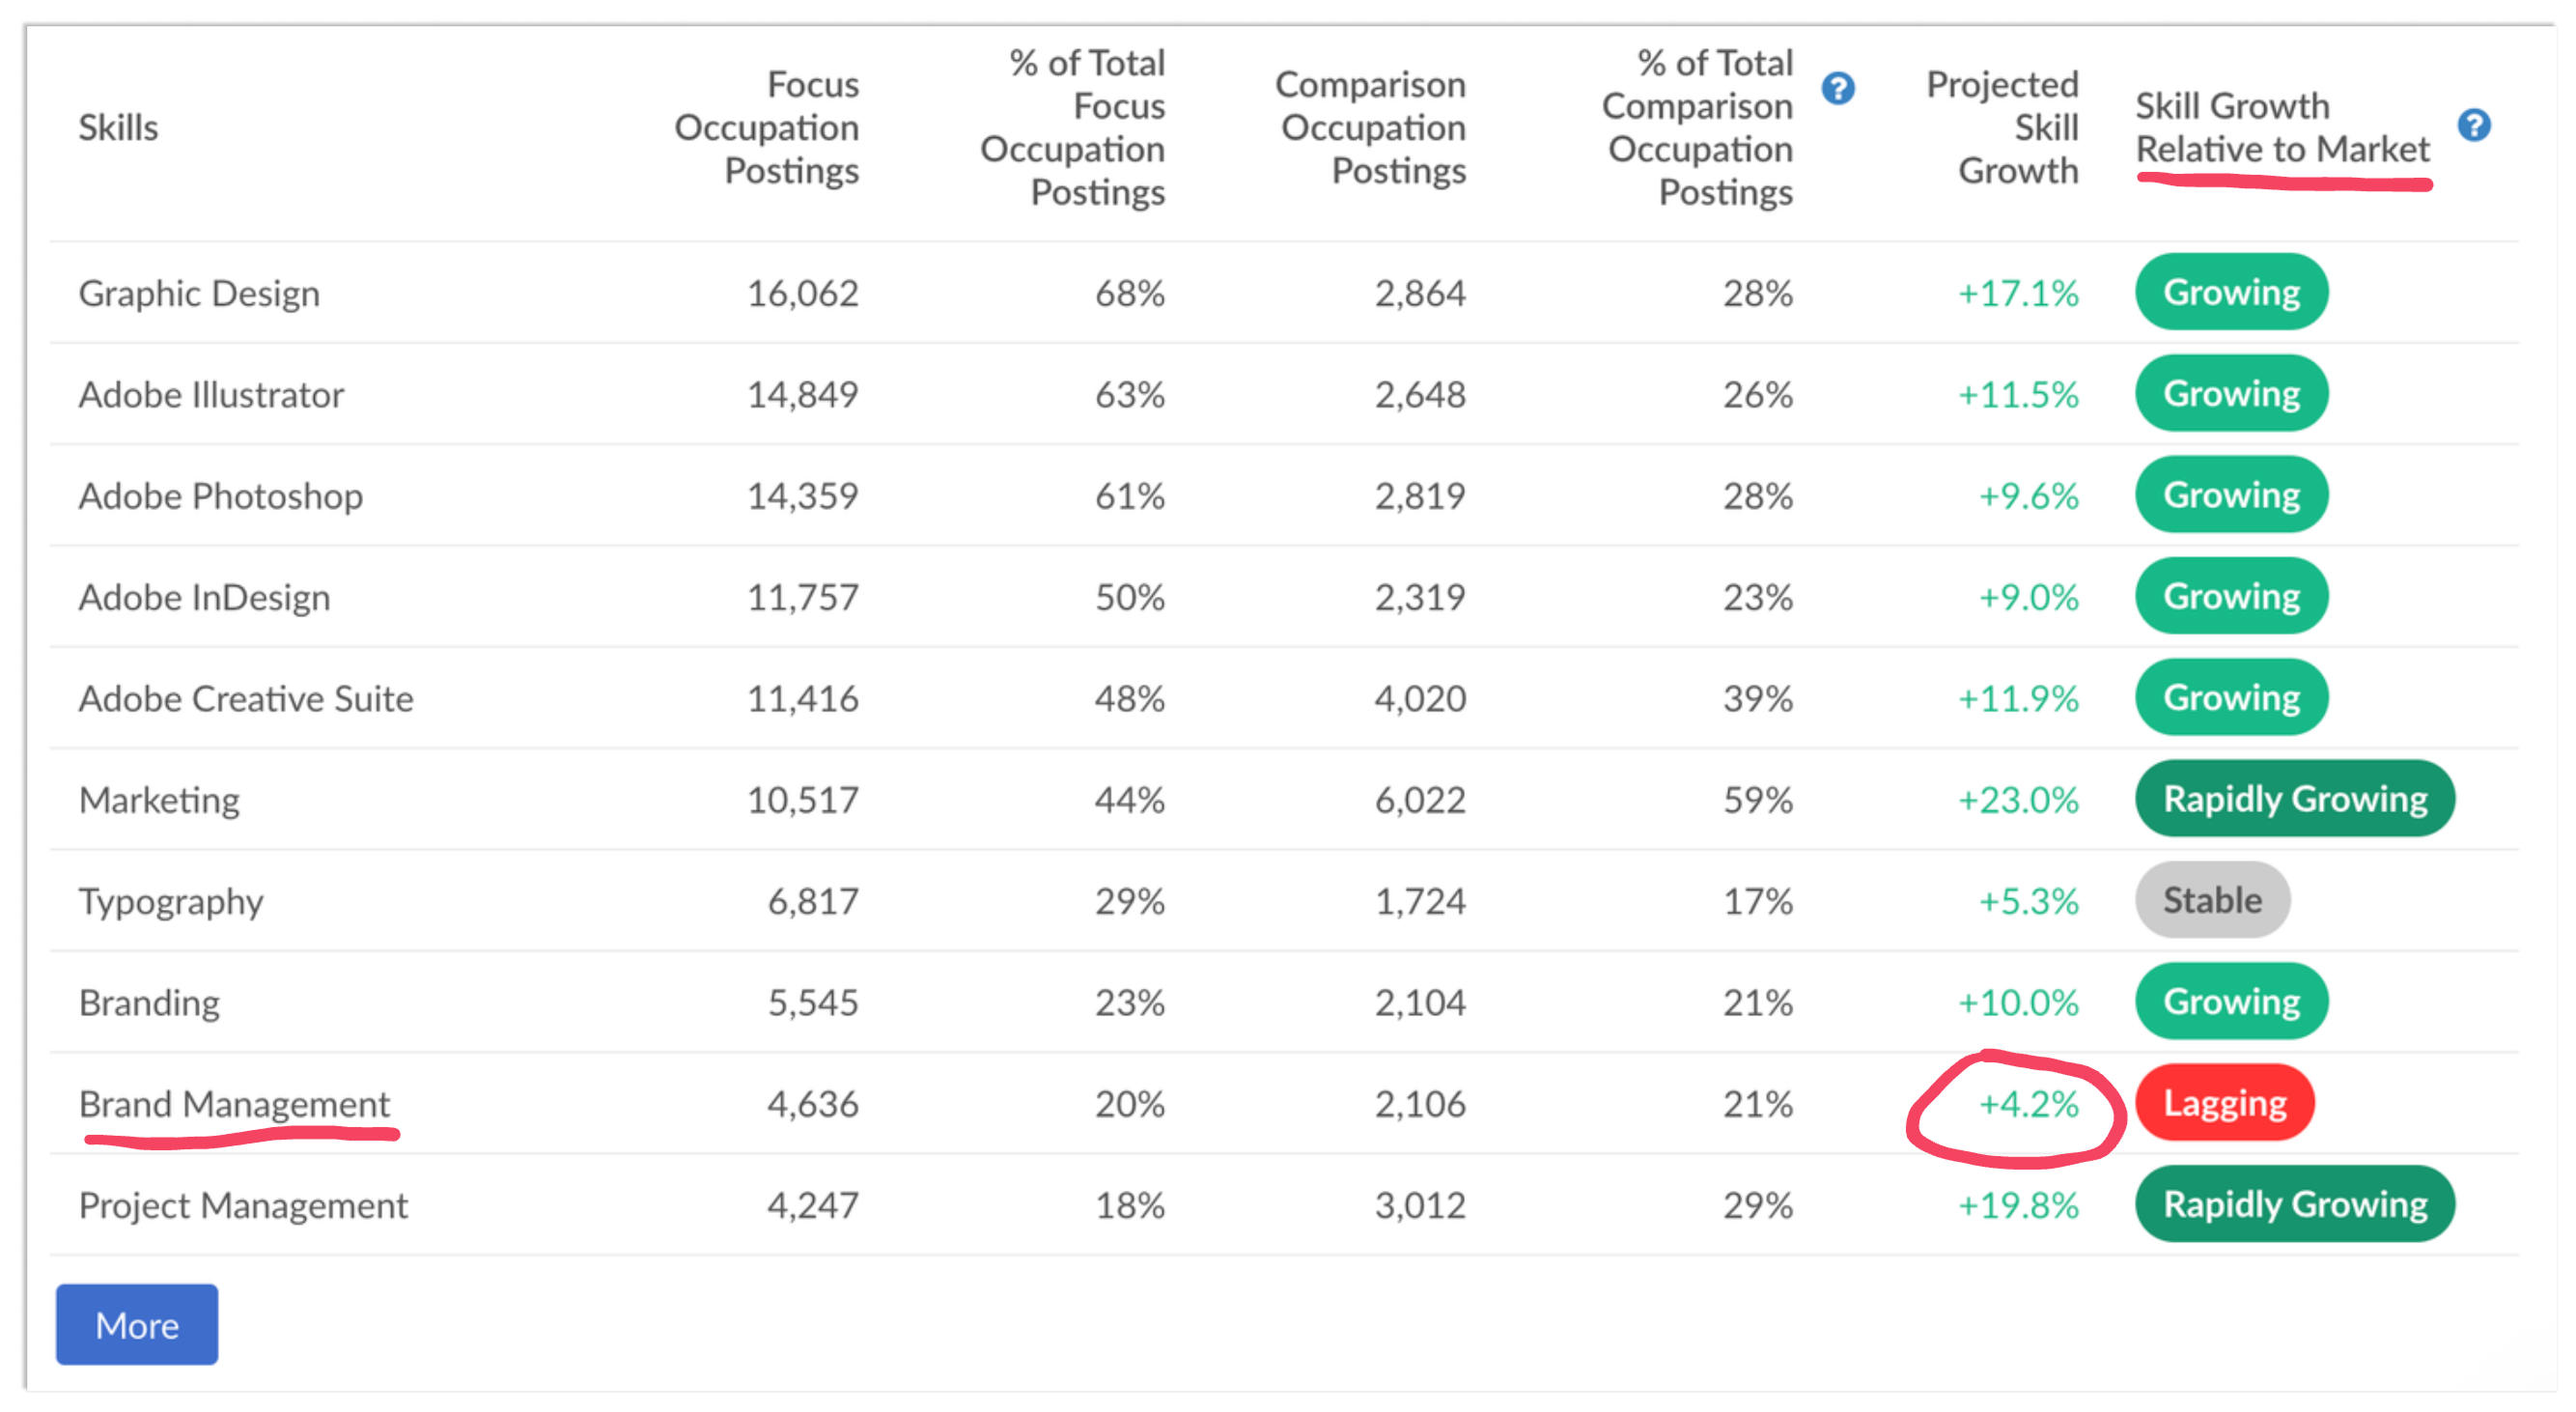
We can scroll down to see this same data in table format, with additional insight into posting volume for each skill as well as projected growth in demand over the next two years.
For example, we see that demand for most of the top Specialized Skills is projected to grow faster than overall market demand. Even Brand Management — the one specialized skill projected to lag market demand — is still projected to grow. The “Lagging” tag simply indicates the rate of growth is anticipated to be slower than overall skill demand growth.
Transitional Skills
Scrolling further down, we come to the last — but not least! — table in the report: The list of top transitional skills needed to make the jump from designer to creative director.
These skills are ranked in order by Importance Score: a proprietary Lightcast metric that captures — on a scale between 1 and 5 — how impactful each skill is in moving from one role to another, based on how different the required skill sets are for each job and how much each skill contributes to earning potential.
![]()
Looking at this list, we see a continued emphasis on setting the vision and direction for a team of designers vs. doing the hands-on work of design (e.g. the three skills with an Importance Score of 5 are all related to this).
Further down the list, we also see the importance of keeping up with Emerging Technologies, and supplementing design experience with competency in Copywriting and Marketing Strategies as well.
These transitional skills should be emphasized in curriculum and, ideally, demonstrated through internships or projects before students complete their credential in pursuit of a Creative Director role.
Creating & Marketing Your Credential
And that’s it. In just a few clicks, we were able to 1) explore next-step jobs 2) analyze skill gaps in employer demand for those jobs, and 3) identify the key transitional skills professionals will need to advance in their career journey.
With this insight, we’re better equipped to design a credential — whether a Brand Management concentration within an MBA program, or a post-bacc certificate in Design Leadership — aligned to the upskilling needs of graphic designers who aspire to creative director roles.
Of course, this same data can play a role in marketing our credential to prospective students. See, for example, how Gies College of Business used data on in-demand skills and career pathways to inform scripts for webinars designed to attract and engage prospective learners for their new graduate certificates.

Conclusion
Labor market data can do more than describe the world of work — it can help shape it. With tools like the Career Pathways report in Analyst, higher education leaders can design programs that meet learners where they are and guide them toward where they want to go next.
If you’d like to see how Analyst can help your institution uncover new opportunities like these, reach out to our team to request a demo today.