As a growing segment of the public questions whether Higher Ed is worth the cost, it's more important than ever for institutions to prove their value.
The #1 value students expect from a college education is a better job–institutions that can demonstrate their ability to give students this will thrive.
This requires redefining student success with career outcomes in mind from the very beginning.
Labor market data is an essential tool for aligning programs with careers and demonstrating that alignment throughout each step of the learner lifecycle.
Continue reading this recap of our webinar with Lightcast’s John Barnshaw (VP of Education Success) to learn how labor market data can strengthen each step of the learner lifecycle, from enrollment to employment.
The value of Higher Ed in question
As public faith in higher ed has wavered, it’s never been more vital for colleges and universities to demonstrate their value. To continue attracting and keeping students in the face of public skepticism, institutions need to show learners that the education they receive will be well worth the investment. This requires asking the question: what do students want from higher ed? To answer, we have to look at what the students themselves are saying.
What students want
An accumulation of 50 years of freshman surveys, the Higher Education Research Institute’s retrospective reveals an undeniable truth: gaining a better job is the #1 priority for why first year students go to college. This answer surpasses other important considerations traditionally linked with higher education, such as gaining a general appreciation of ideas. "Now, the faculty member inside me would say they haven't taken my class, or, we can do both,” says John Barnshaw, Lightcast’s VP of Education Success (and former professor). “I agree. But my point is, at the beginning of the educational experience and that first year experience, for 50 years students have been telling us ‘We want to go to college to get a better job.’”
This fact is also apparent in a survey conducted by Strada and Gallup, where graduates were asked several key questions, including:
Do you believe your institution supported you in establishing a meaningful career?
Do you believe your education was worth the cost?
The results showed a strong correlation between those graduates whose institutions provided a pathway towards a meaningful career, and those who believed their education was worth the investment. “Much to my chagrin, they don't think about my lectures that I gave,” jokes Barnshaw. “They thought about the experiences that they had and they thought about how well we did–or I did–in preparing them for the job that they now inhabit.”
Does this mean that general education isn’t valuable? Not at all–institutions can (and should) prepare students for meaningful careers while at the same time broadening their minds. But it’s clear that what students want most from their college experience is a better job at the end of it. The colleges and universities best positioned for success in this new climate are the ones that can truthfully demonstrate to stakeholders, to the public, and to their students that they are closely aligned with learners' post-college aspirations–which means having career outcomes in mind from the very beginning.
Redefining student success
Traditionally, student success is measured by four benchmarks: enrollment, retention, persistence, and graduation. But as we’ve seen, students define success by what happens after they leave school. Are they well-equipped to work in the field they want? Do they have the salary they need? Do they have a competitive edge over their colleagues? To truly plan for student success, institutions need to look beyond graduation to what awaits their students in the workforce.
This requires redefining student success to include one additional step: career. If each phase of the learner lifecycle is oriented towards that North Star, students can clearly see their desired outcome awaiting them at the end of their education and will be more likely to enroll, persist, and graduate.
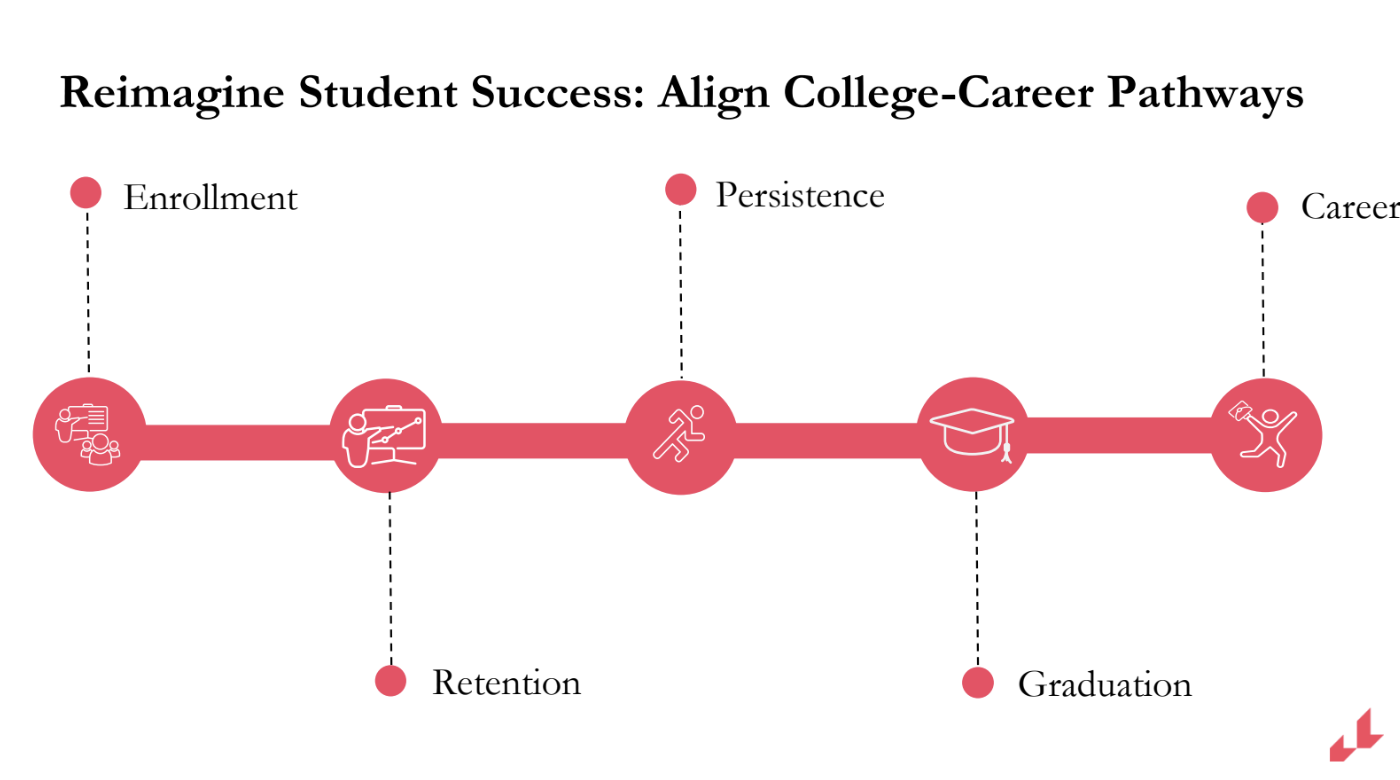
However, adding a step that comes after college–”Career”–means institutions need to look beyond their own front door and into their economic region, developing an understanding of the labor market through reliable data. Let’s take a look at how institutions can use data to support each phase of the learner lifecycle, all the way from enrollment to employment.
Using data to boost enrollment
The first way data can support institutions with enrollment is by helping them discover the right students.For example, say you're a college that's looking to recruit and serve more working adults in your region. CollegeAPP+ allows you to efficiently build a pipeline of prospective adult students, with data covering over 242 million individuals’ intent to enroll in higher education, including current occupation data for over 47 million of those profiles. One significant way this data could be used is to find underserved minorities in your region. (In light of recent SCOTUS decisions on Affirmative Action, this data can help institutions diversify their applicant pool by efficiently finding traditionally overlooked populations in their area.)
Another way institutions can use data to support enrollment is Lightcast’s career exploration tool, Career Coach. After taking a short assessment on the platform, students can explore occupations aligned with their interests, labor market trends, and the programs offered by your particular institution. Clearly demonstrating to prospective students the pathway from your programs to the job they want can be an incredibly effective tool for boosting enrollment–as was the case with South Texas College.
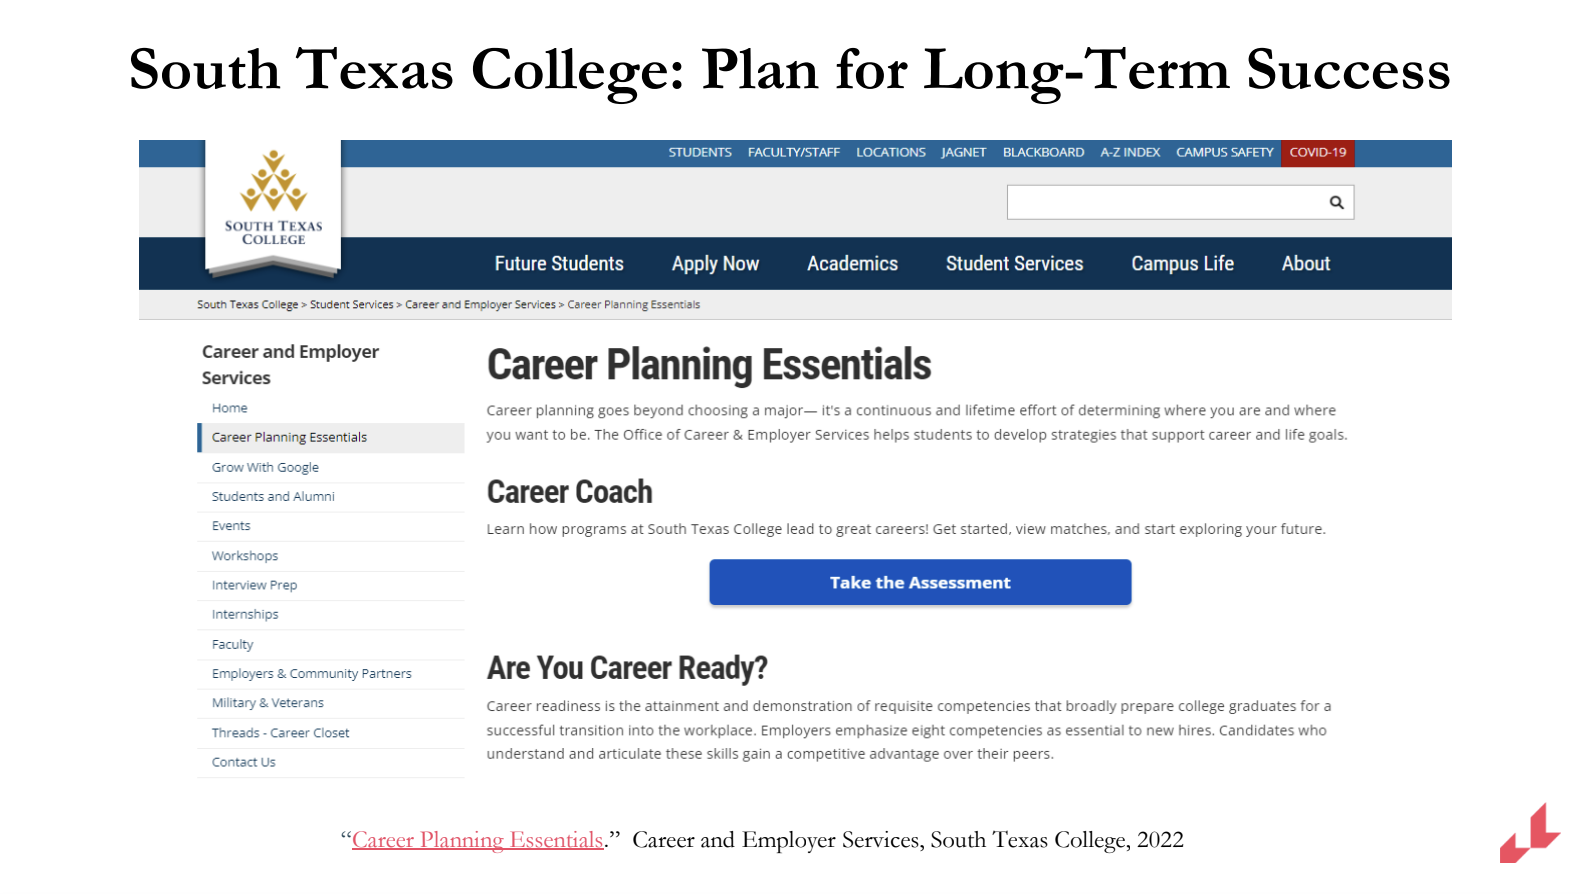
A Hispanic-serving community college, South Texas College was experiencing a 14% enrollment decline due to the pandemic. In the face of these discouraging numbers, they had to get creative. Their solution was to introduce “Career Exploration Days”, an opportunity for high school students to use Career Coach to help discover career options for their future. Before students even had the chance to enroll, STC was already proving to prospective students that they care about helping them find meaningful careers. The result: an increase of first-time degree students by 29% in just 12 months. “Why not start with the number one value proposition?” says Barnshaw. “If they want to go to college to get a better job, show them the better jobs they can get by going to college.”
How to use data to demonstrate value: the Core Four
Once you’ve gotten students through the door, how can you use data to help them persist through graduation? Let’s start by looking at an example. The University of Colorado (CU) has an above average retention rate of 87%, and an unusually high rate of 85% for black or indigenous people of color. A key part of their strategy is a data-supported workbook they developed called Skills for Success. (It’s open to the public–take a look!) This workbook is designed to help students identify the skills they already have, see how those align with in-demand competencies in the labor market, and create a clear plan of the courses they need to take to develop those skills. By empowering students to create clear goals for after graduation, CU gives their students a strong motivation to stay enrolled.
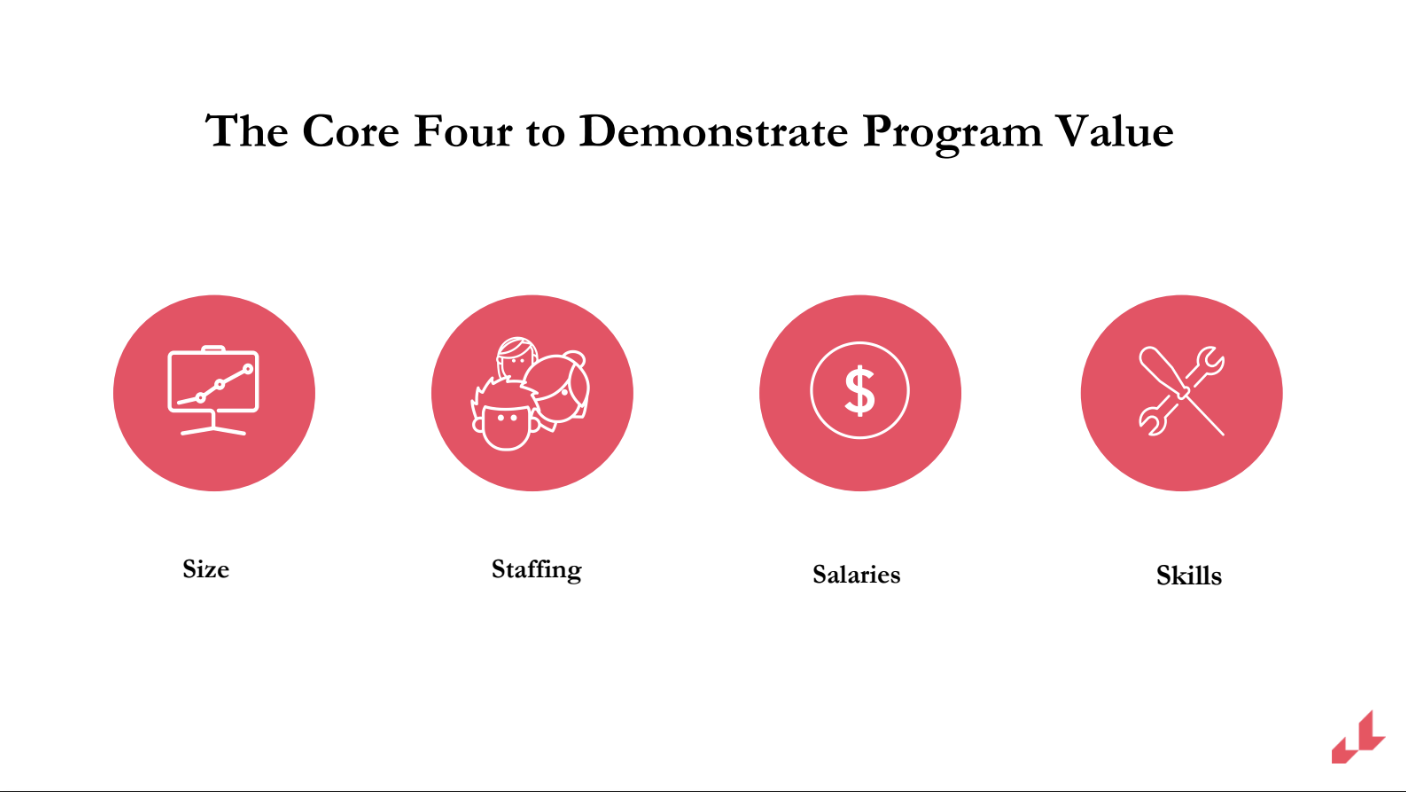
The reason CU’s strategy is so effective is because their programs are aligned with the needs of the labor market in their region–after all, institutions can only demonstrate their value to students if the value is there to begin with. Let’s take a look at how Lightcast’s Analyst platform helps institutions review and develop programs by using the Core Four data points: size, staffing, salaries, and skills.
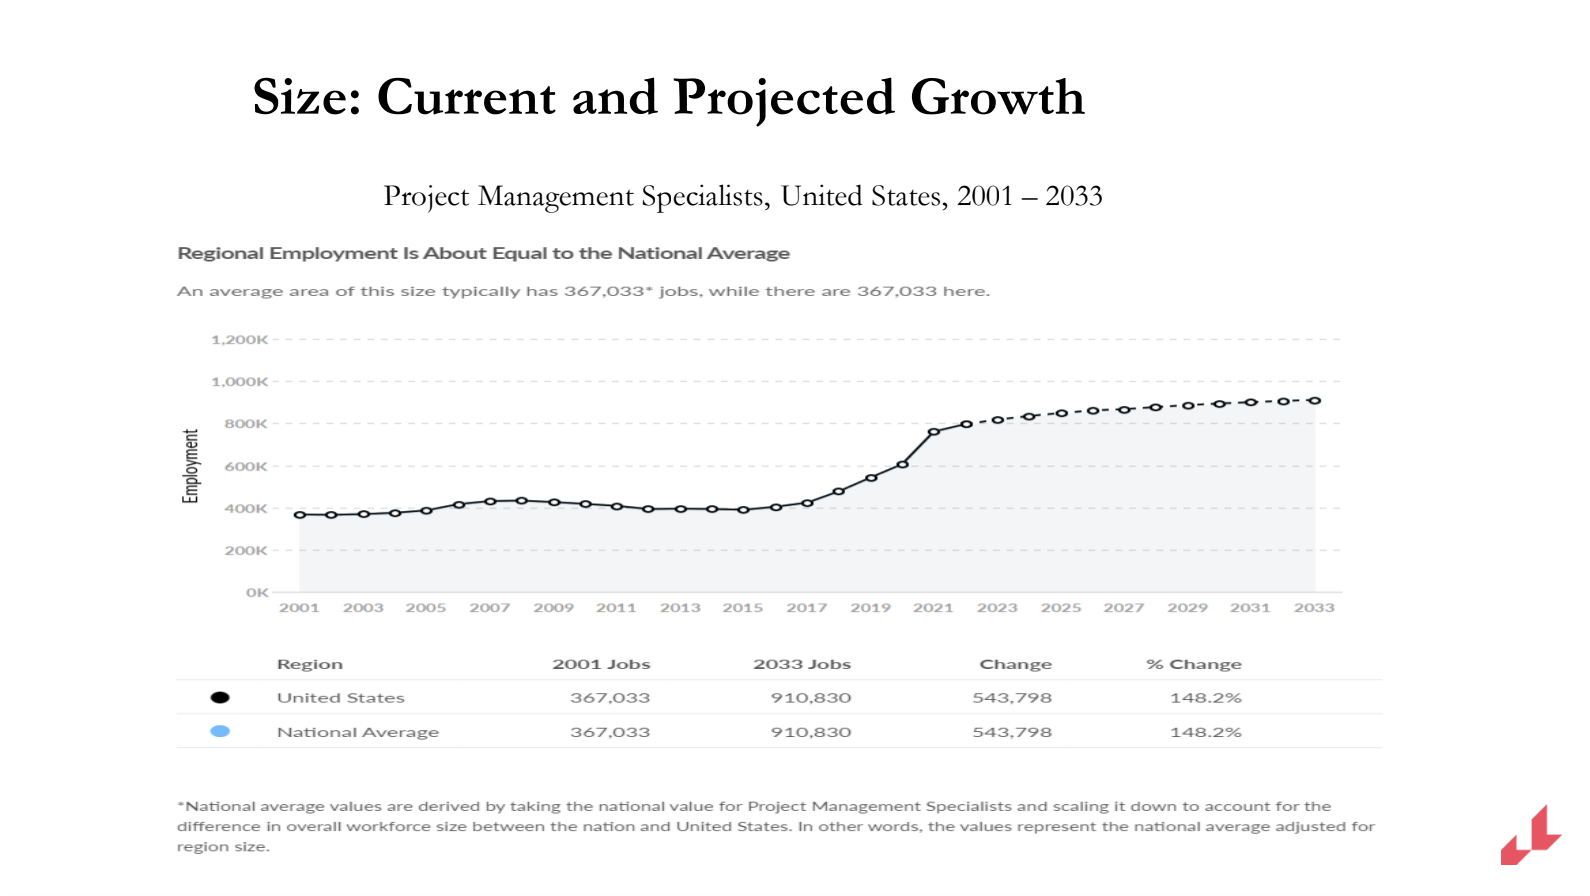
Size
Through Analyst, you can explore what the current and projected economy looks like in your selected region, whether that’s by zip code, county, state, or more. This allows you to see occupations that are on the decline or on the rise, and thus have a better understanding of what programs to invest in–for example, in the region below, project management is expected to grow 148% over the next 32 years.
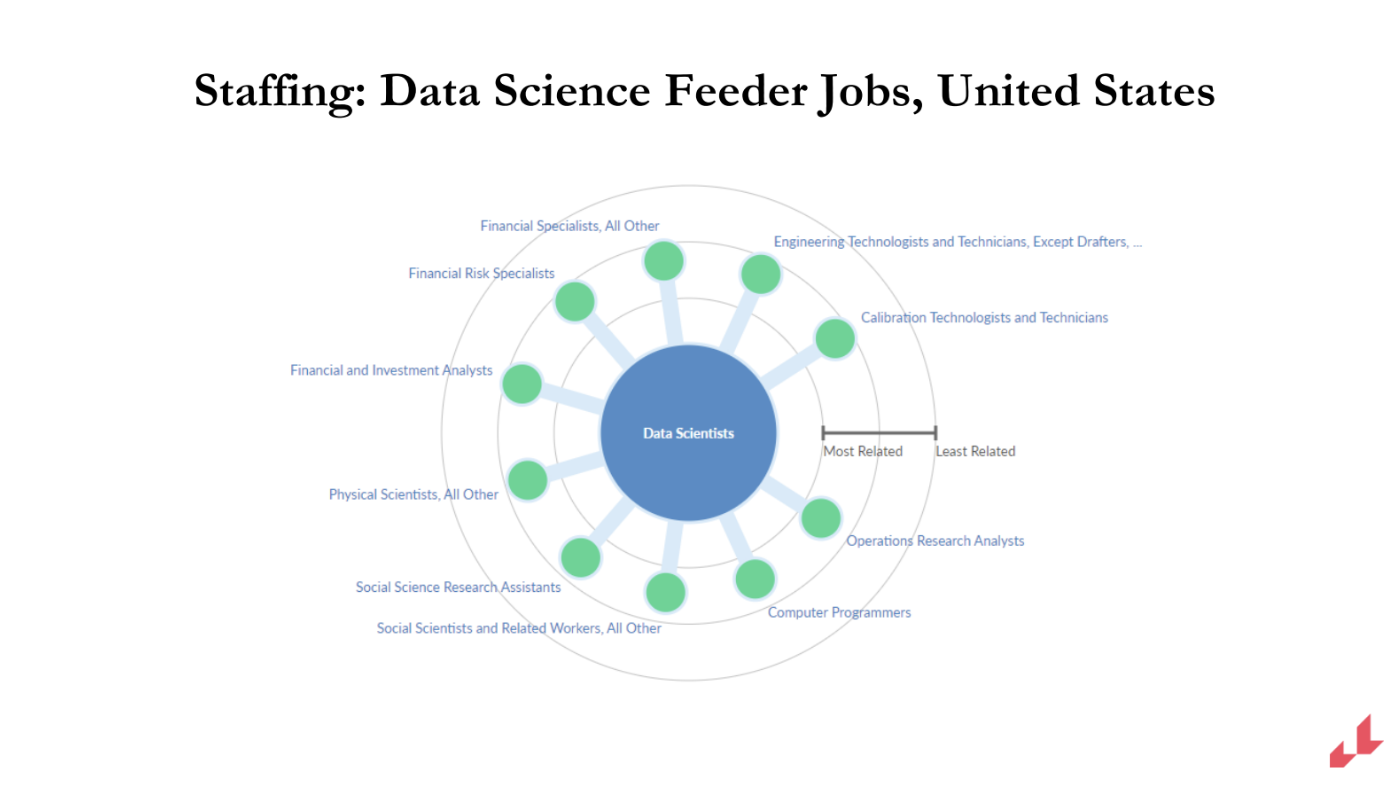
Staffing
By looking at staffing patterns, you can identify those companies in your area that are hiring for specific occupations, which can open the door for internships, practicums, partnerships, and even inviting employees at those companies to come speak at your institution. You can analyze representation in different fields, enabling you to have productive conversations about which industries are successfully representing women and minorities, and how. Last but not least, Analyst’s Career Pathways feature in the U.S. enables you to see feeder jobs and next-step jobs for different occupations, so you can help learners plan their professional growth.
For instance, you can show a student studying data science that they can gain valuable experience by undertaking an internship in computer programming; or that they can use their degree to pivot into another field such as financial risk assessment if they choose to.
Salaries
Analyst also provides salary data for different occupations in your region (so it's more relevant and realistic than national wage data!). When combined with Analyst’s Career Pathways feature, you can look at how feeder jobs compare to one another, and help students understand the increase in pay that one degree (or microcredential) could mean over another. For example, as Barnshaw points out in the clip below, it takes almost 15 years for a registered nurse to earn the same salary as an RN with a certificate in sterile techniques and procedures. Offering this as a microcredential would give your nursing students an immediate advantage in the marketplace–which brings us to skills.
Skills
At the end of the day, skills are what will help your students get jobs in a tough labor market and get ahead in a good one. Lightcast’s occupation taxonomy allows users to dig deep into industries and find the skills that are most valued there in real time. You can then align your program curriculum with these in-demand skills to give your students a competitive edge. For example, many creative writing departments emphasize teaching students proofreading, a required skill in almost any writing job. However, few writing programs include a course on Search Engine Optimization (SEO)–despite this being one of the most in-demand skills for writing jobs in today’s market. With a simple microcredential in SEO, you can enable your students to graduate with a huge advantage over their peers.
The key is to think of skills in terms of DDN: Distinguishing, Defining, and Necessary. “Necessary” skills are foundational skills that are mandatory for a specific job; “defining” skills are those that indicate proficiency; and “distinguishing” skills are those that show expertise. By identifying distinguishing skills in a given profession and creating an opportunity for learners to build those skills, you can set your students apart from their peers. “Having distinguishing skills is really a premium. It can help your students get jobs in a tough labor market, and it can help them better understand the value of higher education beyond what they're learning,” says Barnshaw. “It will drive home the value of education and what they so desperately came to college for, which is to be able to get a better job.”
After graduation
Finally, you can use alumni outcomes data to revitalize every stage of the learner lifecycle, finding insights for program review, marketing efforts, and more. Lightcast’s Alumni Pathways platform simplifies this process. By matching your alumni information to our professional profile database, the platform enables you to easily dig into the specifics of your alumni outcomes data, such as where they work, how much they make, or whether they stay in your region or migrate. And of course, in a time when public faith in higher ed needs bolstering, clear data that demonstrates your alums’ success can help you prove your value to your community, donors, and prospective students, showing that your institution can deliver what students really want from their college experience: a pathway to a better career.
This webinar included a live Q&A with the audience. You can see answers to each question using the time-stamped links below, or watch the full recording here. To learn more about how data can help your students succeed, just reach out--we'd love to hear from you!
Q & A
Where is the skills feature in Lightcast’s data tools?
Can Lightcast data be used for curriculum mapping? How?
Is there any way to look at employers who offer reimbursement options?